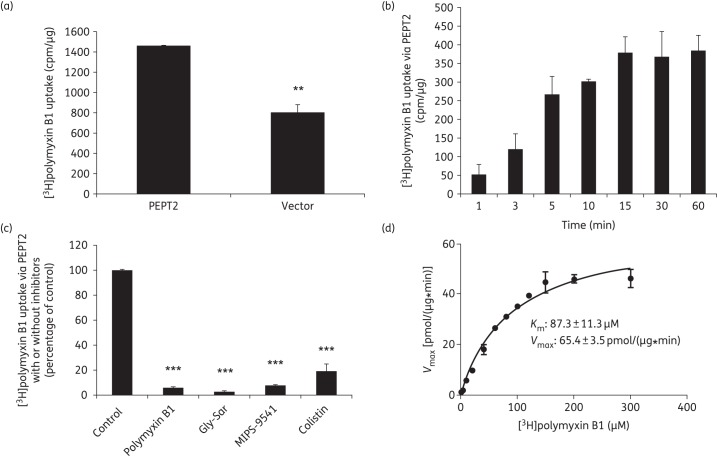
Figure 6.
Molecular characterization of PEPT2-mediated uptake of [3H]polymyxin B1. (a) Uptake of [3H]polymyxin B1 in HEK293 cells transfected with PEPT2 or the vector alone. The vector- and transporter-expressing cells were incubated with 10 μM [3H]polymyxin B1 (in PBS, pH 5.5). Data are expressed as cpm/μg of protein. (b) Time dependence of the PEPT2-mediated [3H]polymyxin B1 uptake. Vector- and transporter-expressing cells were incubated with 10 μM [3H]polymyxin B1 (in PBS, pH 5.5). Data are expressed as cpm/μg of protein. Background counts of vector-transfected cells were subtracted from all uptake data. (c) Inhibition by Gly-Sar, colistin, polymyxin B1 or MIPS-9541 of PEPT2-mediated [3H]polymyxin B1 uptake. [3H]polymyxin B1 uptake was measured in the absence or presence of 20 µM Gly-Sar, colistin, polymyxin B or MIPS-9541 in cells overexpressing human PEPT2 or transfected with the vector alone. Background counts of vector-transfected cells were subtracted from all uptake data and the standardized result is presented as a percentage of the control (i.e. no inhibitors). (d) Kinetic parameters of [3H]polymyxin B1 uptake via PEPT2. Kinetic parameters of [3H]polymyxin B1 uptake were derived in HEK293 cells transiently transfected with PEPT2 or the vector. Uptake was assessed with various concentrations of [3H]polymyxin B1 (ranging from 0 to 300 µM), subtracting the background of vector-transfected control cells. Km and Vmax values of [3H]polymyxin B1 uptake were derived by GraphPad Prism 6.0 software. All experiments were conducted independently three times with three replicates in each experiment and values are expressed as the mean ± SEM. Significant difference from the control: **P < 0.01 and ***P < 0.001.

