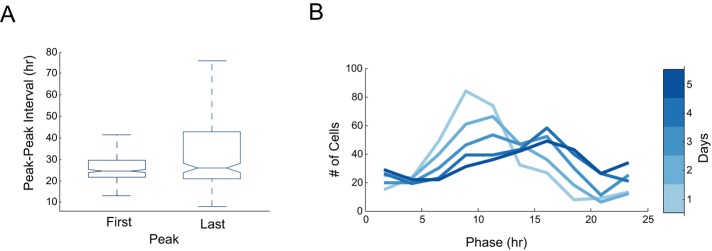
FIGURE 3:
Circadian signals in tissues show an initial synchrony that decays over time. (A) Period, measured by peak–peak interval, was calculated for the first and last circadian periods. Note that both measurements have comparable median values, but the last period has a wider variation. (B) The phase distribution of cells from the calvarial bone is plotted after 1, 2, 3, 4, and 5 d (for both A and B, N = 334 cells).

