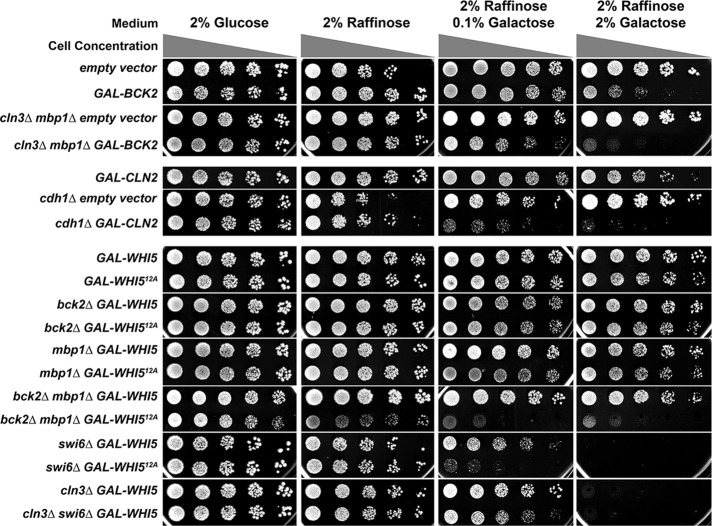
FIGURE 3:
Growth assays for overexpression strains on glucose, raffinose, and galactose. Serial dilutions were spotted as described in Materials and Methods. The sugars contained in the plates are indicated at top. The 0.1% galactose plates were used to obtain lower levels of induction of the GAL1 promoter–driven gene. Gray triangles indicate relative concentrations of cells in the spots. The relevant genotypes of strains are indicated to the left. The GAL1 promoter is abbreviated as GAL.

