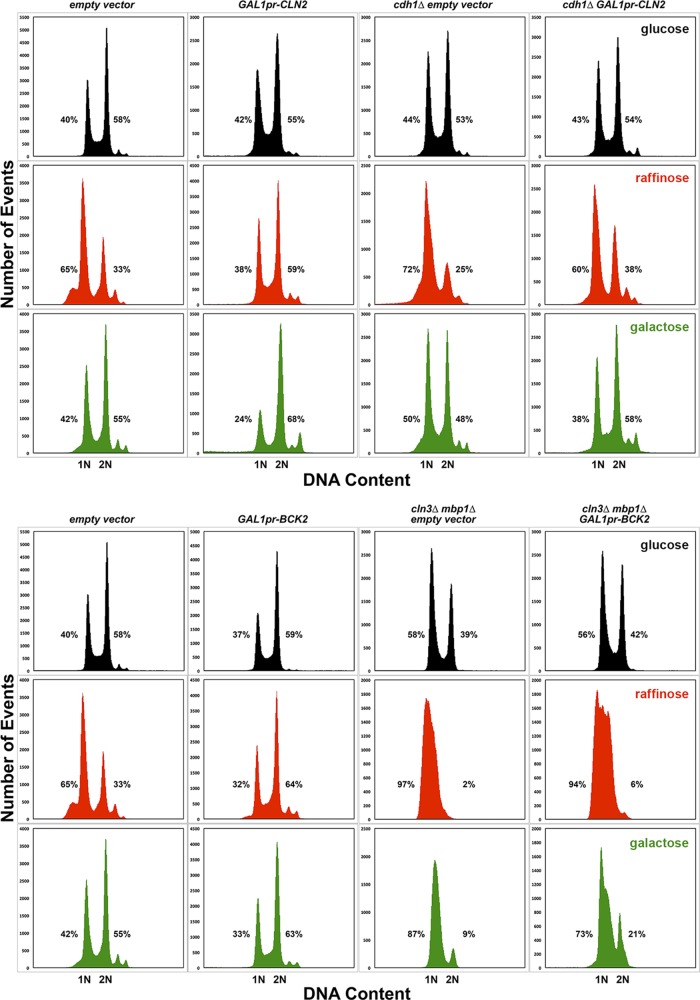
FIGURE 5:
Steady-state DNA content of strains overexpressing CLN2 and BCK2. The DNA content of the strains shown in Figure 4 was determined by flow cytometry, as described in Materials and Methods. Each strain is shown in a column with the cells grown in glucose at top (black), cells grown in raffinose in the middle (red), and cells grown in galactose at the bottom (green), as indicated in the titles. The percentages of cells containing 1N or 2N DNA content are indicated next to each peak. Percentages do not add to 100% because of measured events outside of the peaks but within the gated measurements. The GAL1 promoter is abbreviated as GAL1pr.

