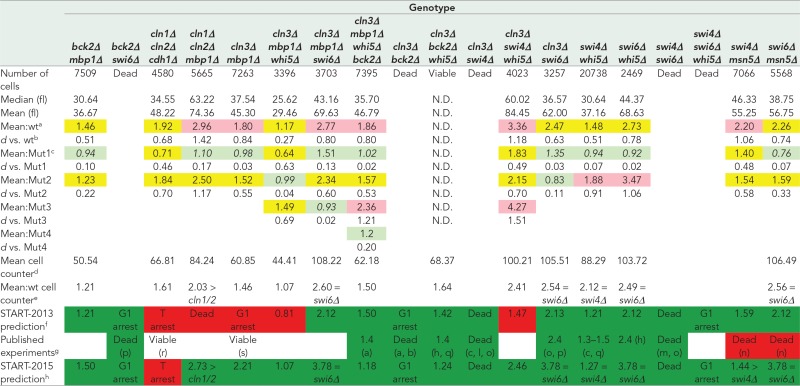
TABLE 2:
Cell size phenotypes of double, triple, and quadruple mutants.
 |
All cell sizes are given in femtoliters.
aRatio of the mean cell size of the mutant strain (all replicates pooled) compared with wild-type (wt) cells (all replicates pooled) from live-cell microscopy experiments. Light green cells, mean cell size is the same as wt (small effect size, d ≤ 0.2). Yellow cells, mean cell size is smaller or larger than wt with a medium effect size (0.2 < d < 0.8). Pink cells, mean cell size is smaller or larger than wt with a large effect size (d ≥ 0.8).
bCohen’s d effect size for log-transformed cell sizes (see Materials and Methods).
cRatio of the mean cell size of the mutant strain (all replicates pooled) compared with the first single mutant in the indicated genotype (Mut1) from live-cell microscopy experiments. Mut2 is the second single mutant in the genotype, and so on. Cell coloring is the same as for the mean cell sizes relative to the wt strain. Numbers in italics indicate the single mutants closest in size to the multiple deletion mutant.
dMean cell size from automated cell counter measurements (see Materials and Methods). Most measurements are of a single biological replicate. When multiple replicates were measured, the number is the mean from the replicates.
eRatio of the mean cell size to the mean cell size of the wt strain from automated cell counter measurements.
fSTART-2013 model–simulated mutant cell size at division relative to wt cell size at division. Dark green cells, measurements agree with model prediction. Red cells, measurements disagree with model prediction.
gMean population cell size of mutants relative to wt cells reported in the literature as cited. Citations are the same as in Table 1 with the additional following citations: r. Cross et al. (2002), s. Bean et al. (2006). Dark green cells, measurements agree with published observations. Red cells, measurements disagree with published observations. Uncolored cells, literature provides only viability data.
hRelative cell size prediction from START-2015 model incorporating changes to better fit new data (see Discussion). Dark green cells, measurements agree with model prediction. Red cells, measurements disagree with model prediction.
