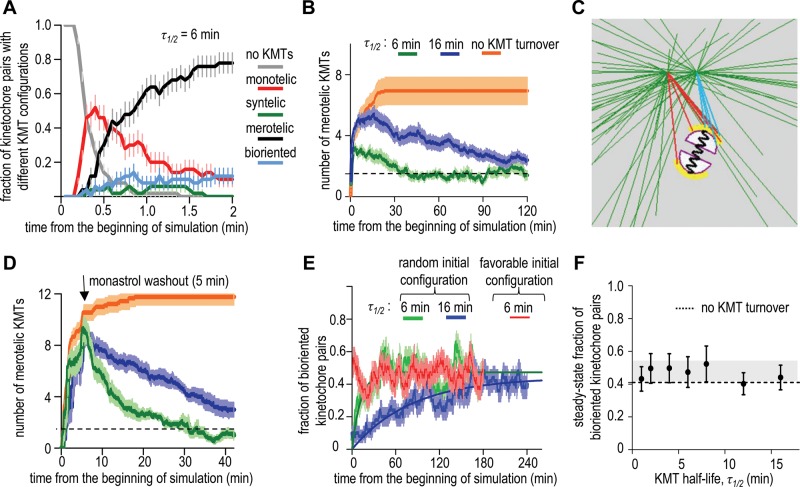
FIGURE 2:
Impact of the initial system configuration and KMT turnover rate. (A) KMT configurations for the geometrically constrained kinetochores. Data here and in B and E are average of 50 in silico experiments; error bars are SEMs. Two minutes after the beginning of mitosis in silico almost all kinetochores are merotelic, i.e., they have at least one KMT from a wrong pole. (B) Average number of merotelic KMTs per sister kinetochore as a function of time for different KMT half-lives in the presence of geometric constraints. When the kinetochore’s initial position is random, many merotelic KMTs attach during the first few minutes, but then their number peaks and declines gradually if KMT turnover is present. For comparison, the kinetochore pair oriented along spindle axis and positioned midway between two separated poles (favorable configuration) has on average 1.5 merotelic KMTs per sister kinetochore at all times (dashed horizontal line). (C) Screenshot from Supplemental Video 5, in which the initial configuration mimics monopolar spindles in monastrol-treated cells. This screenshot shows separating spindle poles and merotelic KMTs. Red and blue colors depict KMTs from different poles. (D) Quantification for simulations that start from monastrol-induced configuration. Same colors as on B; number of simulations is 10. Note the larger peak amplitudes. (E) Kinetics of biorientation for kinetochores that were positioned randomly in a nascent spindle (green and blue) or for the favorably positioned kinetochore in a fully formed spindle (red). Solid lines are exponential fits. (F) The steady-state fraction of bioriented kinetochore pairs for different KMT half-lives (50 simulations for each point; error bars are SEMs). Dashed line shows the model solution for favorably positioned kinetochores with no KMT turnover; horizontal gray bar shows SD range for the steady-state solutions.

