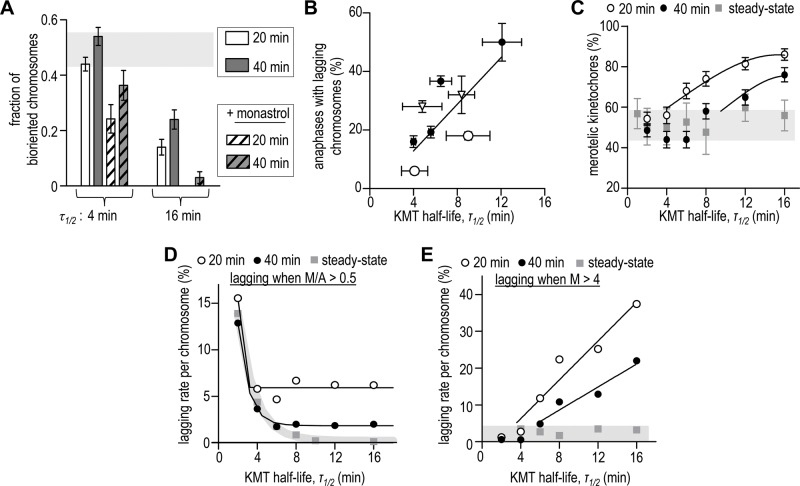
FIGURE 5:
Comparison between model and experiment. (A) Fraction of bioriented chromosomes calculated at 20 and 40 min from the beginning of simulations; most mammalian cells divide within this time range. Values are averages over 2-min intervals at indicated times; bars are SDs; horizontal gray bar shows SD range for the steady-state solutions (from Figure 2F), so variations within this bar are not statistically significant. Calculations for “+ monastrol” started from initial configuration similar to Figure 2C. (B) Percent of anaphases with lagging chromosomes in different human cell lines vs. KMT half-life at metaphase (data from Bakhoum et al., 2009; Kabeche and Compton, 2013). Duration of mitosis in these cells varies from 20 to 40 min (Brito and Rieder, 2009). Solid line is a linear fit to all points. Open circles are data for RPE1 cells (τ1/2 = 4 min) and RPE1 + MCAK RNAi (τ1/2 = 9 min) cells; open triangles are data for U2OS cells from two cited studies. (C) Percent of kinetochores with merotelic KMTs calculated at 20 and 40 min from the beginning of simulations. Our model does not describe anaphase events, but these data correspond to the percent of merotelic kinetochores that would have been observed at anaphase onset that started at these times. Kinetochore was called merotelic if, by the end of calculation, it had at least one merotelic KMT. Results for the steady state were recorded after 3-h simulations; horizontal gray bar shows the SD range for steady-state solutions. Solid lines are exponential fits for the values that exceed this range. (D) Lagging rate per chromosome (percent of divisions with lagging chromosomes normalized to the number of chromosomes in cell) was calculated under assumption that only the kinetochores with M/A > 0.5 become lagging. Lagging rate per chromosome is used to enable the comparison of biorientation accuracy in cells with different ploidy. (E) Lagging rate per chromosome was calculated under assumption that only the kinetochores with M > 4 become lagging.

