
FIGURE 6:
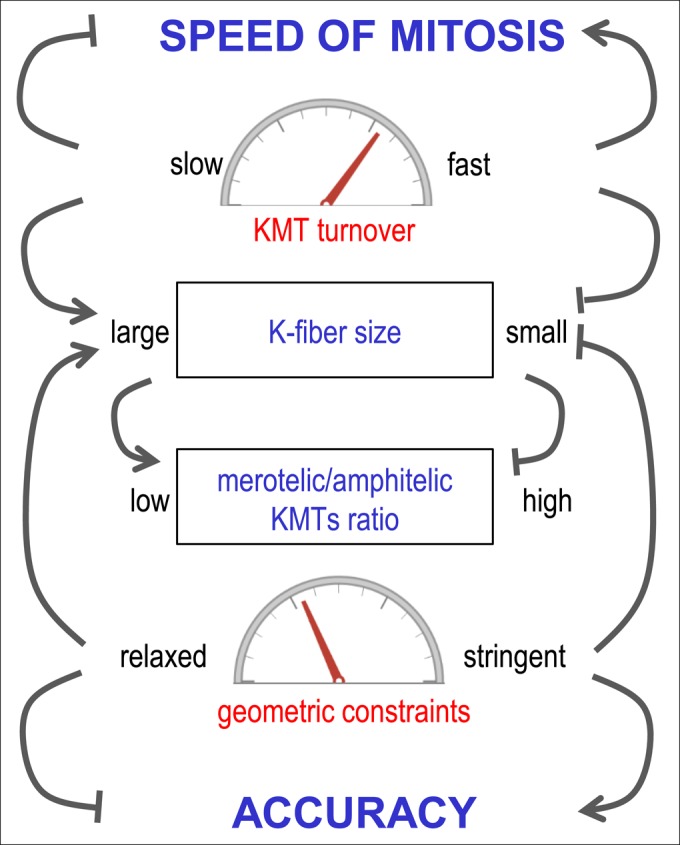
Major model findings about the roles of KMT turnover and geometric constraints. This diagram summarizes complex relationships between KMT turnover and geometric constraints and their impact on the accuracy and speed of chromosome segregation and on the size and M/A ratio of kinetochore MT-containing fiber. Arrow-headed lines correspond to positive effects; bar-headed lines correspond to inhibitory effects; see Discussion for details.