
FIGURE 7:
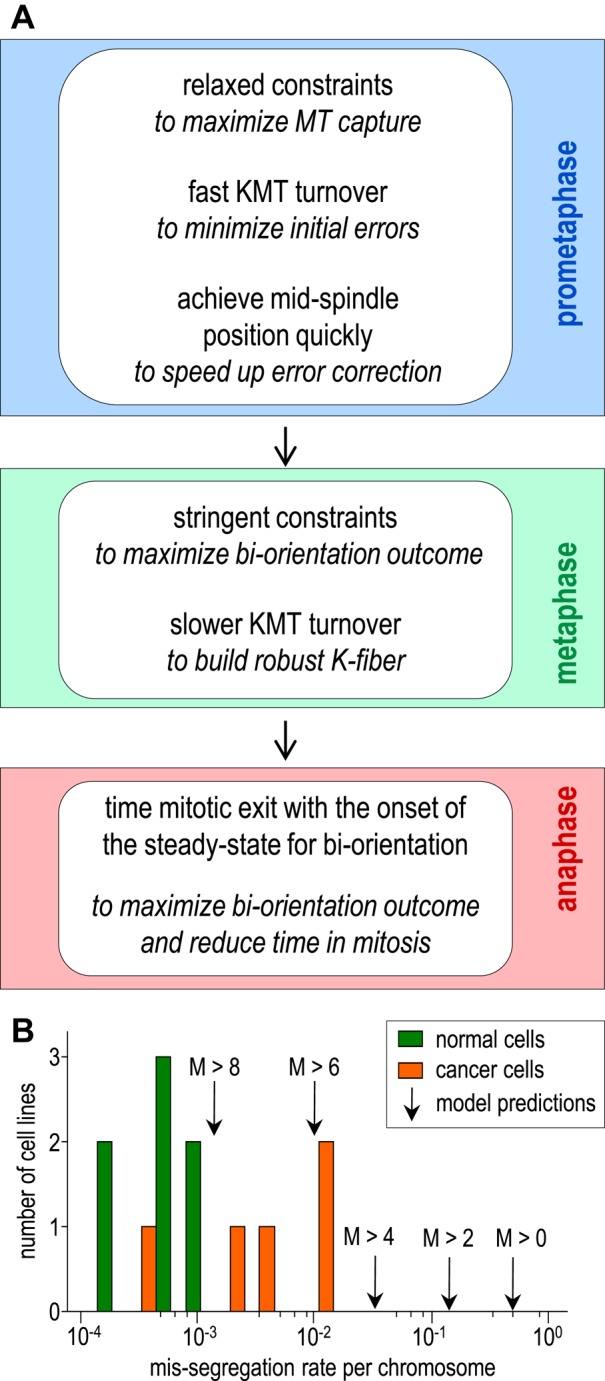
Predicted strategy to achieve optimal biorientation via the basic mechanism and the resulting rate of chromosome mis-segregation. (A) Optimization of the KMT stability and geometric constraints allows achieving multiple goals during mitotic progression; see Discussion for details. (B) Histogram of the mis-segregation rate per chromosome (logarithmic scale) for different cell lines (Supplemental Table S1). Model predictions are for different numbers of merotelic MTs (M); chromosomes are assumed to mis-segregate when M is larger than indicated. Mis-segregation rate is the highest when the model assumes that any number of merotelic KMTs (M > 0) cause a mis-segregation of this chromosome.