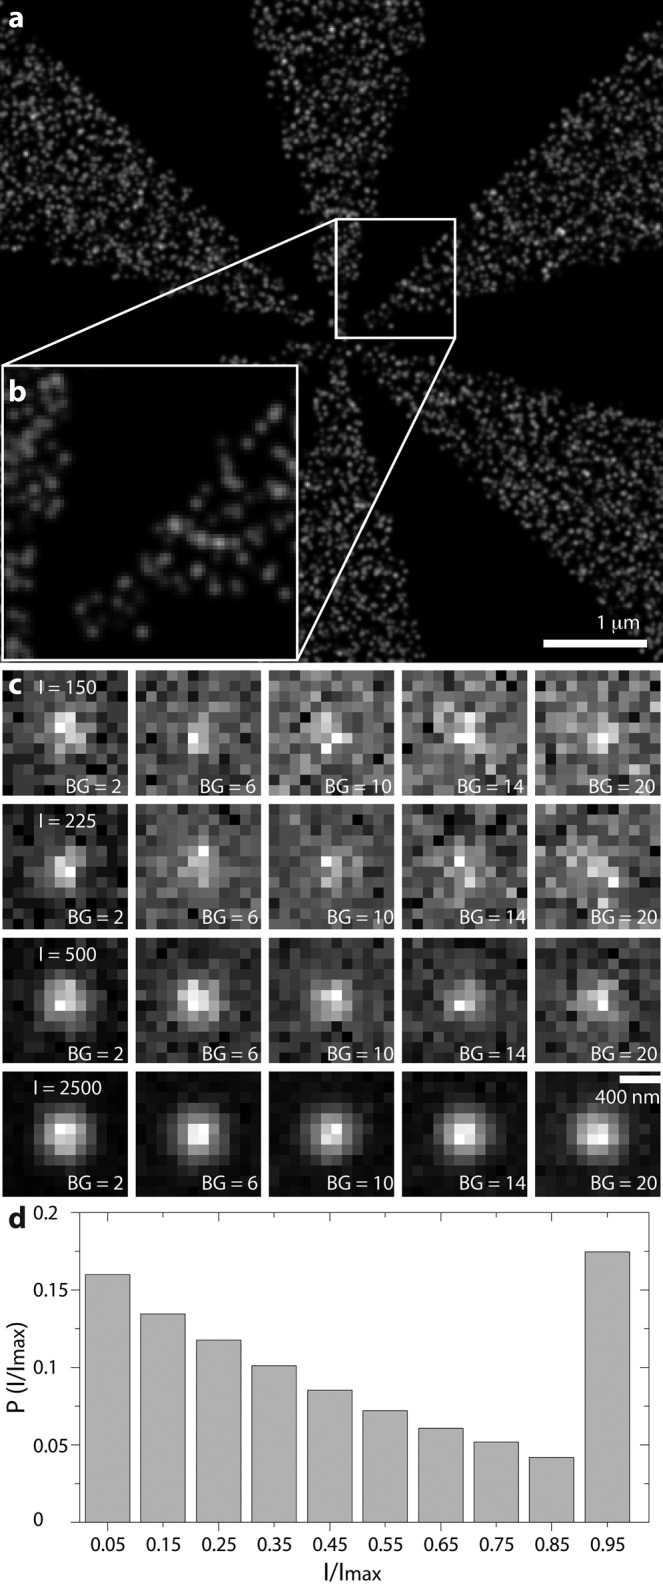
FIGURE 1:

Simulation object and PSF examples. (a) Superresolution reconstruction of a Siemens star as used in the simulations. Time projections in which each single molecule is replaced by its localization precision. (b) Zoom-in on a, visualizing the achieved resolution at the highest-frequency region of the object. (c) Examples of simulated single-molecule images as used in simulations with varying signal (Imax) and background rates (in photons) as indicated. An area of 12 × 12 pixels with σPSF = 1.39 pixels. (d) Single-molecule intensity distribution resulting from a Markov process simulation for the STORM experiment, where the maximum “on” time is >1 frame.
