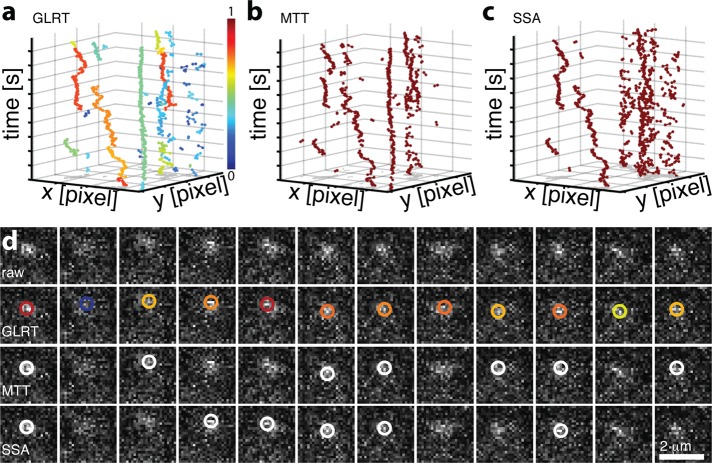
FIGURE 4:
Effect of GLRT detection on tracking of single mRNAs in living yeast. (a–c) Constructed traces based on 1072 ± 26 detections and identical linking parameters for (a) GLRT, (b) MTT, and (c) SSA. The color scheme in a indicates the average detection probability of the detected position underlying the tracking. (d) Sample raw data for detection of fluorescently labeled single mRNAs in a living cell using GLRT, MTT, and SSA as indicated. Color scheme of GLRT as in a.

