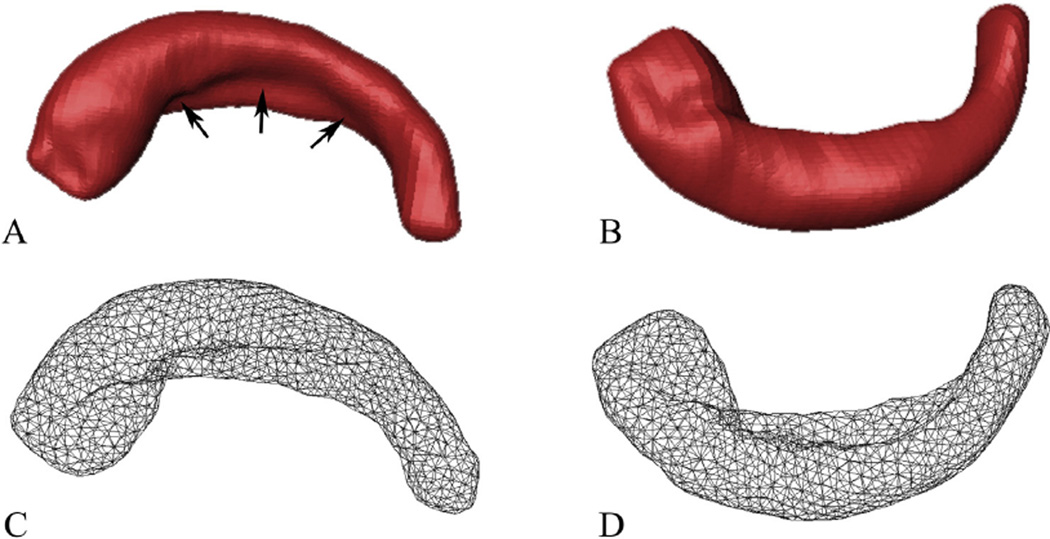
Fig. 3.
Superior (left) and inferior (right) views of one 3D model of the right HF and its corresponding surface meshes. (A and B) The 3D representation models reconstructed from the segmented masks. (C and D) The corresponding mesh representations. The black arrows in A show the hippocampal fissure.

