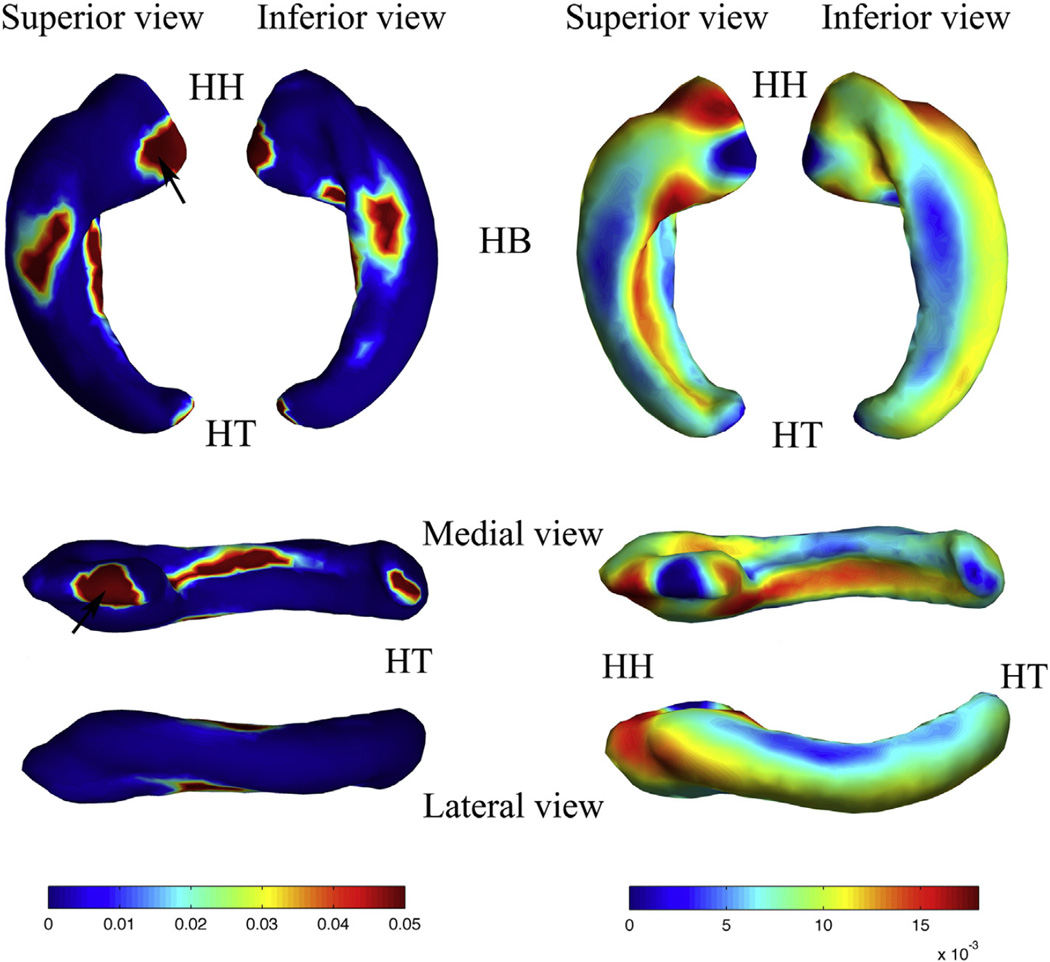
Fig. 5.
p value map (left) and regression coefficient map (right) of the shape statistics of the left HF. Superior, inferior, medial, and lateral views are shown, respectively. Abbreviations: (HH) hippocampal head; (HB) hippocampal body; (HT) hippocampal tail. The black arrows in the p value map indicate the regions adjacent to amygdala.

