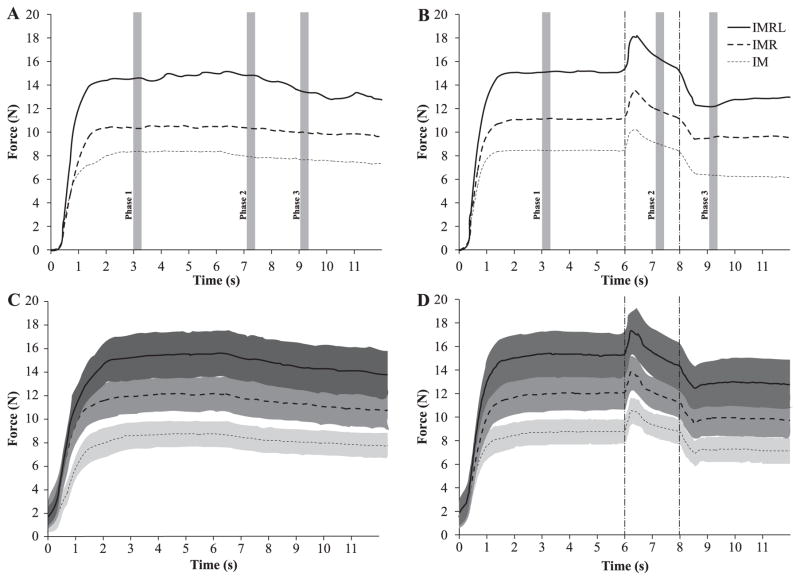
Figure 2.
Panels A and B show the average across trials performance of a representative subject for the IM, IMR, and IMRL tasks. Control trials (without perturbations) are shown in Panel A and C and perturbation trials in Panel B and D. Panels C and D show the mean performance across all subjects in newtons with standard error shades. Note that while subjects performed each task at a level, which corresponded to 20% of his or her MVC (with the fingers to be used in the condition), these data to not reflect this experimental normalization. The figure accurately conveys the fact, however, that target force increased with each finger added to the task. Shaded vertical stripes represent the three 250-ms phases during which subjects' performance was analyzed. Vertical dotted lines represent the time the sensors started moving upward (first line) and when they began moving downward (second line).

