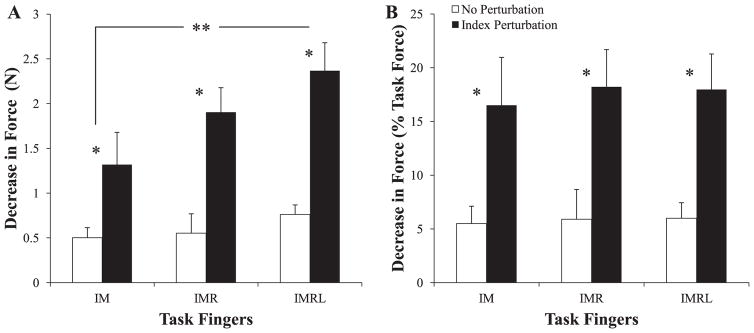
Figure 3.
The magnitude of the decrease in total force, ΔFTOT, from phase-1 to phase-3. Mean values across subjects with standard error bars and shown in panel A. Panel B shows the mean magnitudes normalized by the force subjects were instructed to produce at phase-1. * denotes significant differences in ΔFTOT between perturbed and unperturbed trials; ** denotes significant differences in ΔFTOT between IM- and IMRL-pressing conditions.

