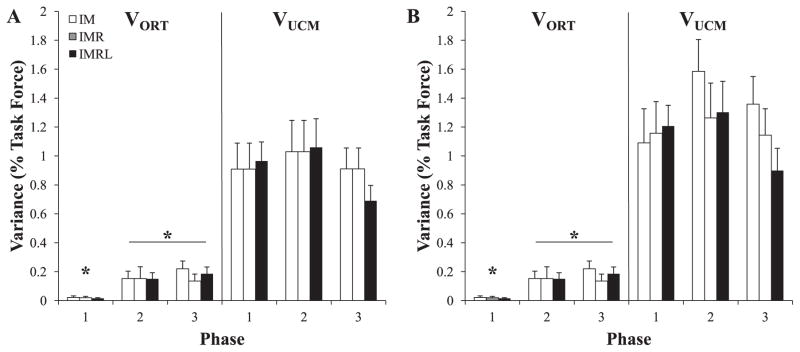
Figure 4.
Two components of inter-trial variance, within the UCM (VUCM) and orthogonal to the UCM (VORT). The results of analysis are presented for the three phases of action in both force space (Panel A) and mode space (Panel B). Each finger-pressing condition is represented by bar style (IM = open; IMR = shaded; IMRL = filled). At each phase, VUCM was significantly smaller than VORT; * signifies that VORT was significantly smaller during phase-1 than it was during phase-2 and phase-3. Mean data across subjects with standard error bars are shown.

