Figure 1.
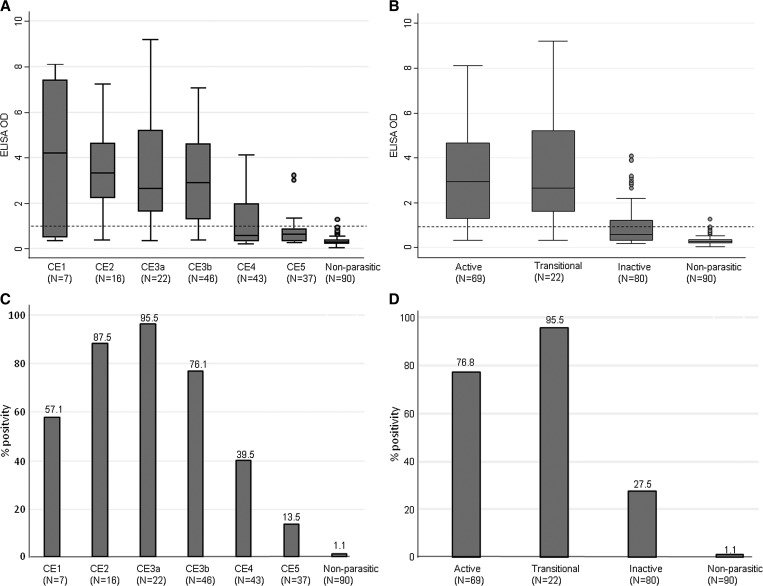
Enzyme-linked immunosorbent assay optical density (ELISA OD) values and positivity rates in the investigated groups. Median, interquartile range (IQR), and minimum and maximum values of ELISA OD values in patients groups according to cyst stage (A) and activity (B) and control patients with nonparasitic cysts. Dashed lines represent the OD cutoff for positivity. (A) CE2 vs. CE4, CE2 vs. CE5, CE3a vs. CE4, CE3a vs. CE5, CE3b vs. CE4, and CE3b vs. CE5 P < 0.001. Any cyst stage vs. nonparasitic P < 0.001. All other comparisons are nonsignificant. Adjusted P value for significance = 0.001. (B) Active vs. transitional P = 0.324; all other comparisons P < 0.001. Adjusted P value for significance = 0.004. Percentage ELISA positivity rate in patients groups according to cyst stage (C) and activity (D). (C) CE2 vs. CE4 and CE3b vs. CE4 P = 0.001; CE2 vs. CE5, CE3a vs. CE4, CE3a vs. CE5, and CE3b vs. CE5 P < 0.001. All other comparisons are nonsignificant. (D) Active vs. transitional P = 0.062; all other comparisons P < 0.001.

