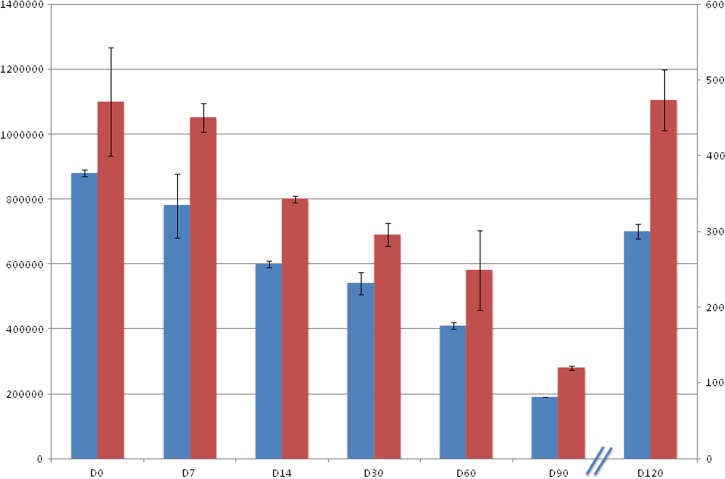
Figure 1.
Histogram of changes in Mycobacterium ulcerans inoculum in soil. Blue boxes, M. ulcerans Agy99; red boxes, M. ulcerans ATCC 33728; x axis, time (days), note that x axis was broken after D90 to change the y axis scale; left-hand y axis and right-hand y axis, M. ulcerans inoculum (colony-forming units).

