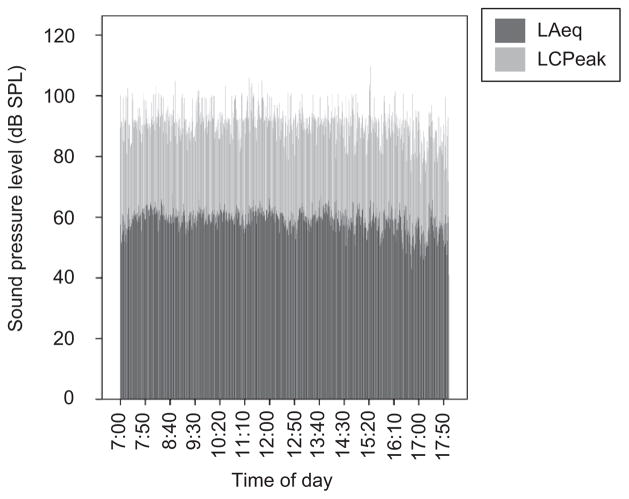
Figure 4.
LAeq and LCpeak noise levels in the main office over the duration of a “typical” day in the outpatient chemotherapy unit. The time of day is on the x-axis, and the sound pressure level is on the y-axis. The LAeq at each moment of time is shown in dark grey, while the LCPeak is shown in light grey

