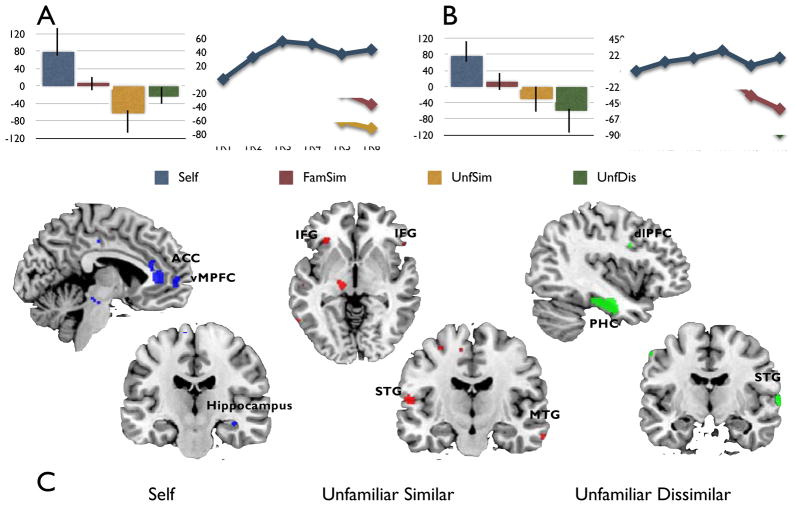
Figure 3.
Results from non-rotated PLS analysis: Latent Variables 2 and 3 (LV 2, LV 3). (A) Plot of brain scores with confidence intervals and temporal brain scores for the contrast Self > UnfSim from LV 2 (B) Plot of brain scores with confidence intervals and temporal brain scores for the contrast Self > UnfDis from LV 3. (C) Regions in blue were preferentially associated with Self, those in red were preferentially associated with UnfSim, and those in green were preferentially associated with UnfDis. All regions are shown at a threshold of p < .001.

