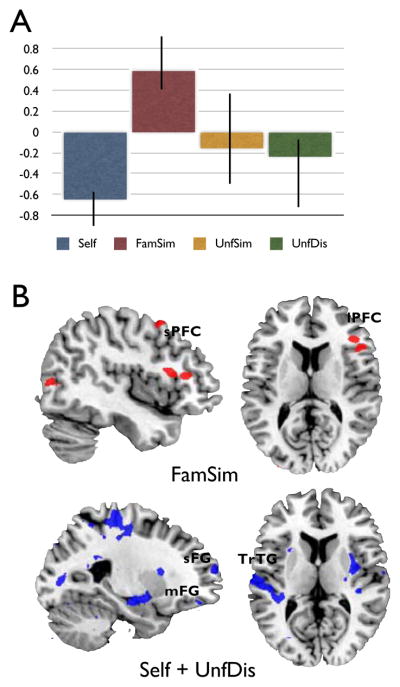
Figure 4.
Results from seed PLS analysis: Latent Variable 3 (LV 4). (A) Plot of brain scores with confidence intervals. (B) Regions with negative saliences (blue) co-vary with the hippocampal seed during the Self and UnfDis conditions. Regions with positive saliences (red) co-vary with the hippocampal seed during the FamSim condition.

