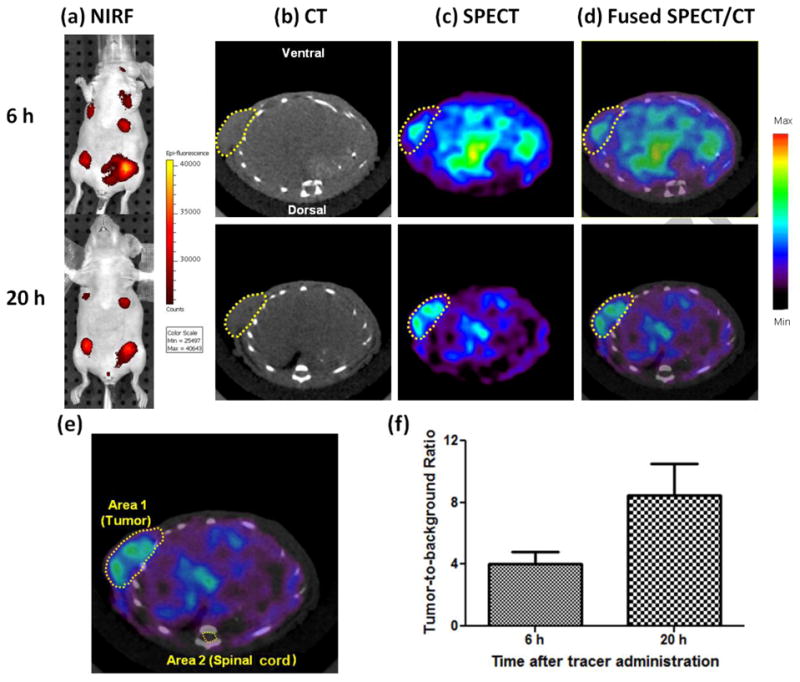
Figure 2.

Representative in vivo SPECT/CT and NIRF imaging of probe 99mTc-PC-1007. (a) Epi-fluorescence imaging of tumor-bearing mice at 6h and 20 h pi. (b) Transaxial CT, (c) SPECT and (d) fused SPECT/CT images of 99mTc-PC-1007 at 6h and 20 h pi. (e) Example of ROI measurement of Area 1 (Tumor) and Area 2 (Spinal cord as background) on a typical transaxial SPECT/CT image. (f) Tumor-to-background ratios calculated as ratio of accumulated radioactivity in designated areas (n=3 per time point). Note: tumors are indicated by yellow dotted circles on all images.
