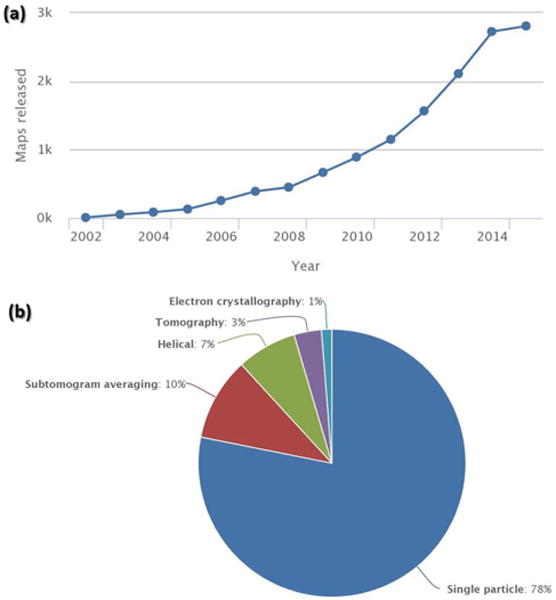
Figure 17.

The details of the total number of 3D density maps deposited in the EM data bank (EMDB). a) Cumulative number of 3D maps released per year. The rate of deposition of density maps has increased significantly in recent years. b) Distribution of available density maps (2802 in total) as a function of technique used: single particle reconstruction (more than ca. 78%) and ET methods (ca. 20%); including subvolume averaging (ca. 10%), helical structures (ca. 7%), general ET (ca. 3%). Electron crystallography adds ca. 1% to the EMDB. Plots and pie chart were produced from data published by the EMDB.[269]
