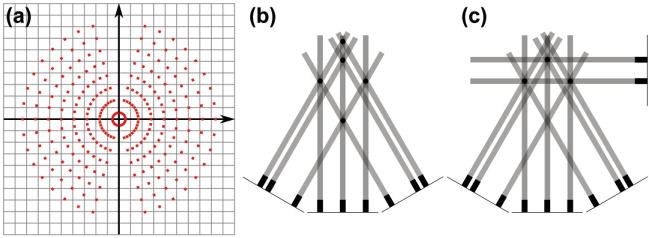
Figure 4.

a) The mismatch between information sampled by a 17-image tilt series with equal angular increments (red dots) and a square Cartesian grid. The interpolation method used to combine this data can strongly influence the final reconstruction. Radon back-projection is used to avoid interpolation in space interpolation. b) A simplified example of Radon back-projection for a set of 3 low-tilt projections producing 5 possible object locations (black dots). c) The addition of a high-tilt projection uniquely defines the existence and location of only 3 objects.
