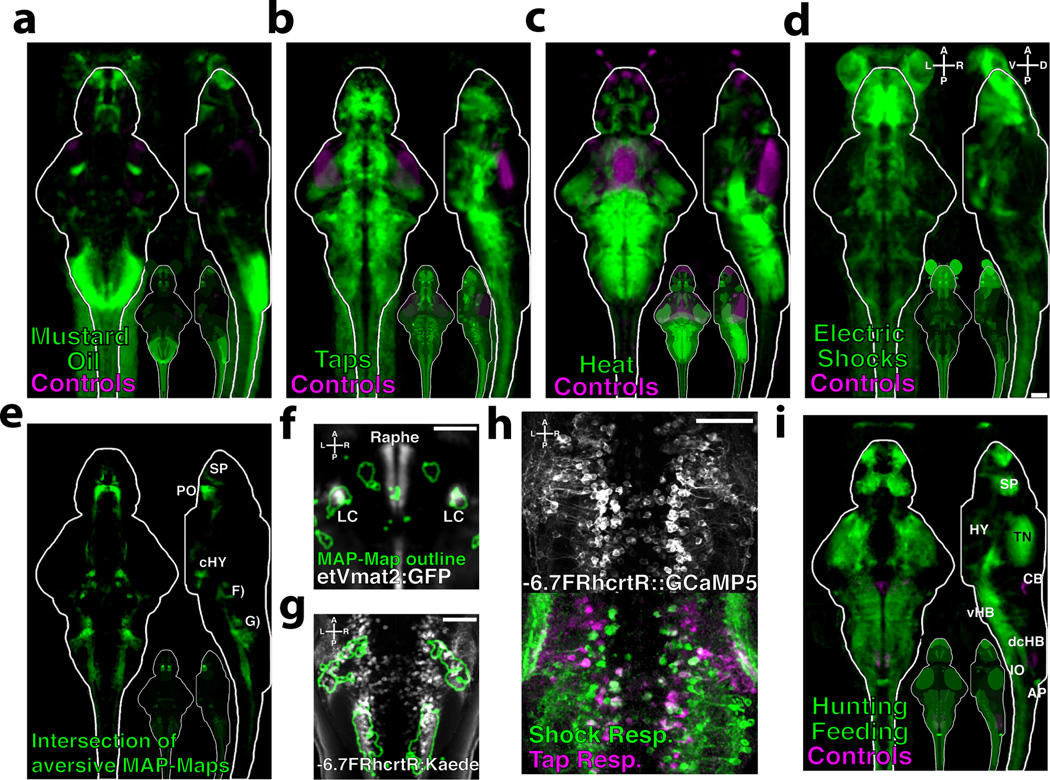
Figure 4. Activity induced by aversive stimuli and hunting/feeding.
Fish were exposed to aversive stimuli for 15 minutes, and MAP-Mapped A) 10uM Mustard oil vs. DMSO controls (n = 19/18 fish) B) Dish-taps vs. no taps controls (n = 28/29 fish) C) 37°C Heat vs. room temperature controls (n = 23/21 fish) D) Electric shocks vs. controls (n = 21/21 fish) E) The intersection of the MAP-Maps in A–D. Subpallium (SP), preoptic area (PO), caudal hypothalamic neural cluster (cHY). F) Z-Brain virtual colocalization reveals co-activation of the locus coeruleus (LC) labeled by Et(Vmat2:GFP), and G) cells labeled by the Tg(−6.7FRhcrtR:gal4VP16;UAS:Kaede) line in the caudal hindbrain H) 2-photon Ca2+ imaging of Tg(−6.7FRhcrtR:gal4VP16);Tg(UAS:GCaMP5G) transgenic larvae stimulated with dish-taps and electric shocks. Functional images depict fluorescence correlation with the stimuli. i) MAP-Map revealing the activity induced by a 1hr of paramecia exposure, mapped relative to a non-fed control group (n = 28/23). Tectal neuropil (TN), hypothalamus (Hy), area postrema (AP), subpallium (Sp), ventral hindbrain (vHB), inferior olive (IO), cerebellum (CB), dorsal-caudal hindbrain (dcHB). Scale bars represent 50um

