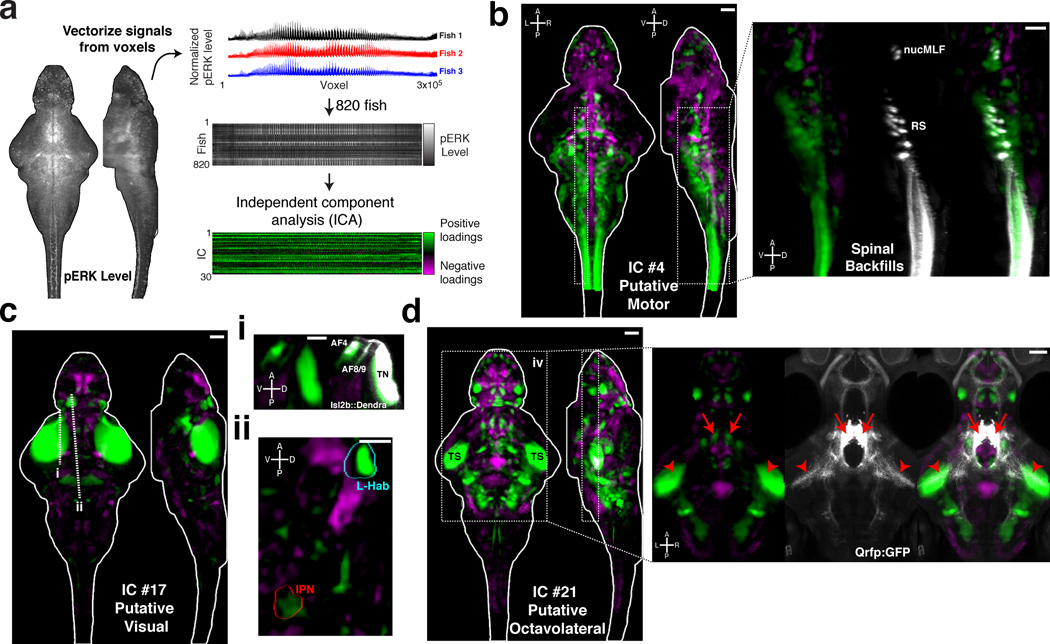
Figure 5. Spatial independent component analysis across fish as a method to localize functional brain networks.
A) The pERK level stack is reshaped into a vector, and the vectors from 820 fish are then combined into an array for independent component analysis (ICA) (see Online Methods) B–D) Voxels for each recovered independent component (IC) are painted with their intensity proportional to the z-score of the loadings of the ICA signal linearly mapped between z = 1–4, and are shown as maximum Z and X projections. B) IC #4 highlights a putative motor network, which associates regions overlapping with reticulospinal neurons (RS), the nucleus of the medial longitudinal fascicle (nucMLF), and the spinal cord. Overlap with the spinal backfill Z-Brain label is shown as an X-projection over the boxed area (right). C) IC #17 highlights a putative visual response network. i) This IC overlaps with areas of the retinal arborization fields (AF) 4, 8 and 9, and the tectal neuropil (TN) labeled by Tg(Isl2b:Gal4);Tg(uas:Dendra) in the Z-Brain. ii) Prominent signals are also observed in the left habenula (L-Hab) and interpeduncular nucleus (IPN). Dashed lines represent the position of the resliced views in ii and iii. D) IC #21 highlights a putative octavolateral network, since it contains prominent signals in the torus semicircularis (TS). Foci of signal in the rostral hypothalamus overlap with the cell bodies of Tg(Qrfp:GFP) labeled neurons (right panel, arrows), which send projections to the TS (arrowheads), implicating these cells in the network.

