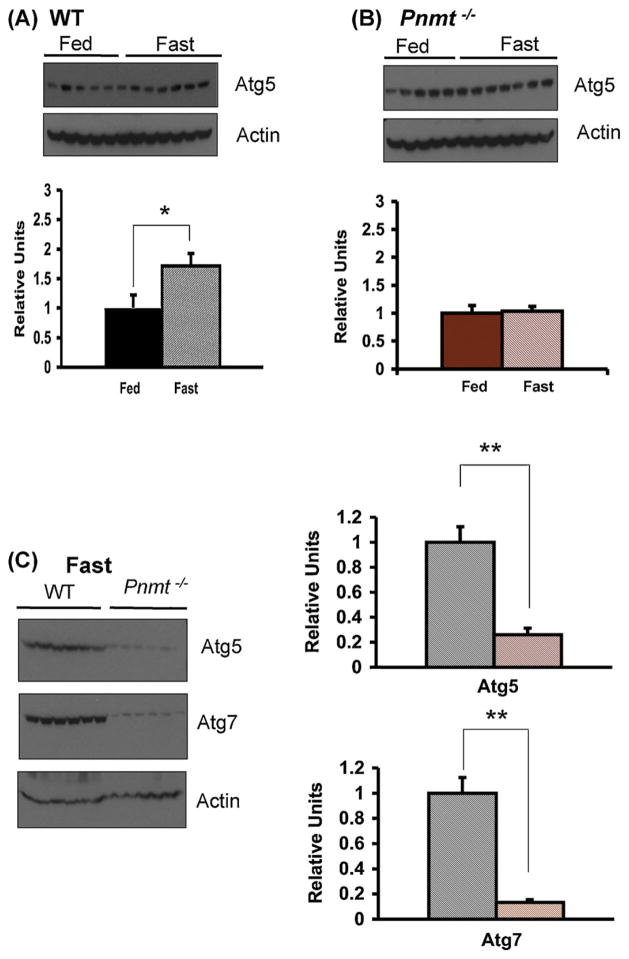
Fig. 7.
Autophagy in Pnmt −/− mice. Western blot of Atg5 in WT (A) and Pnmt −/− (B) mice without and with 24 h of fasting normalized to actin. There was a significant increase in Atg5 levels with fasting in WT mice (A). Atg5 levels in Pnmt −/− mice (B) were unchanged after fasting. (C) Western blot and quantification of Atg5 and Atg7 levels normalized to actin after 24 h of fasting in WT and Pnmt −/− mice. Fasted Atg5 and Atg7 levels in Pnmt −/− mice were respectively 4-fold and 8-fold lower than fasted WT levels. *p < 0.05; **p < 0.01. Color legend as in Fig. 1. (For interpretation of the references to color in this figure legend, the reader is referred to the web version of this article.)

