Figure 5.
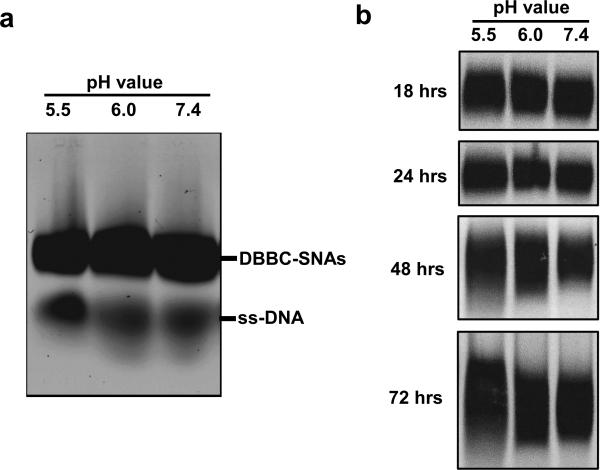
The pH-dependent degradation of DBBC-based micelle-SNAs. Samples were incubated in 50 mM MES buffer (pH 5.5), 50 mM HEPES buffer (pH 6.0), or 1X PBS (pH 7.4). Agarose gel electrophoresis was used to monitor the degradation process. a) Degradation of DBBC-based micelle-SNAs after 24 hour incubation under different pH buffer conditions. Note that a significant amount of single stranded DNA can be observed in the gel image; b) the mobility and shape of the DBBC-based SNA bands over incubation time under different buffer conditions. In the first 24 hours, the SNA bands look relatively sharp. However, as the incubation time increases, the bands become smeared and diffuse, indicating the gradual degradation of the entire micellar structures. Note that the micelles held at lower pH (5.5) suffer considerably more degradation after 72 hours.

