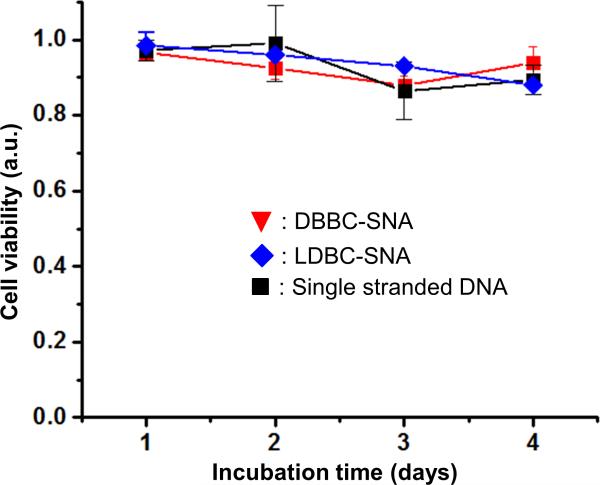
Figure 6.
Cellular toxicity of DBBC-based micelle-SNAs analyzed by a standard MTT assay. Cells treated with DBBC-SNAs (red), LDBC-SNAs (blue), and single stranded DNA (black) at the same total DNA concentration (2 μM). Viable cells with active metabolism convert MTT into a purple colored formazan product with an absorbance maximum near 570 nm, and cell viability was quantified by normalization of the absorbance at 570 nm to non-treated cells. Error bar are standard deviation of absorbance at 570 nm from 3 independent wells of cells in a 96-well plate.

