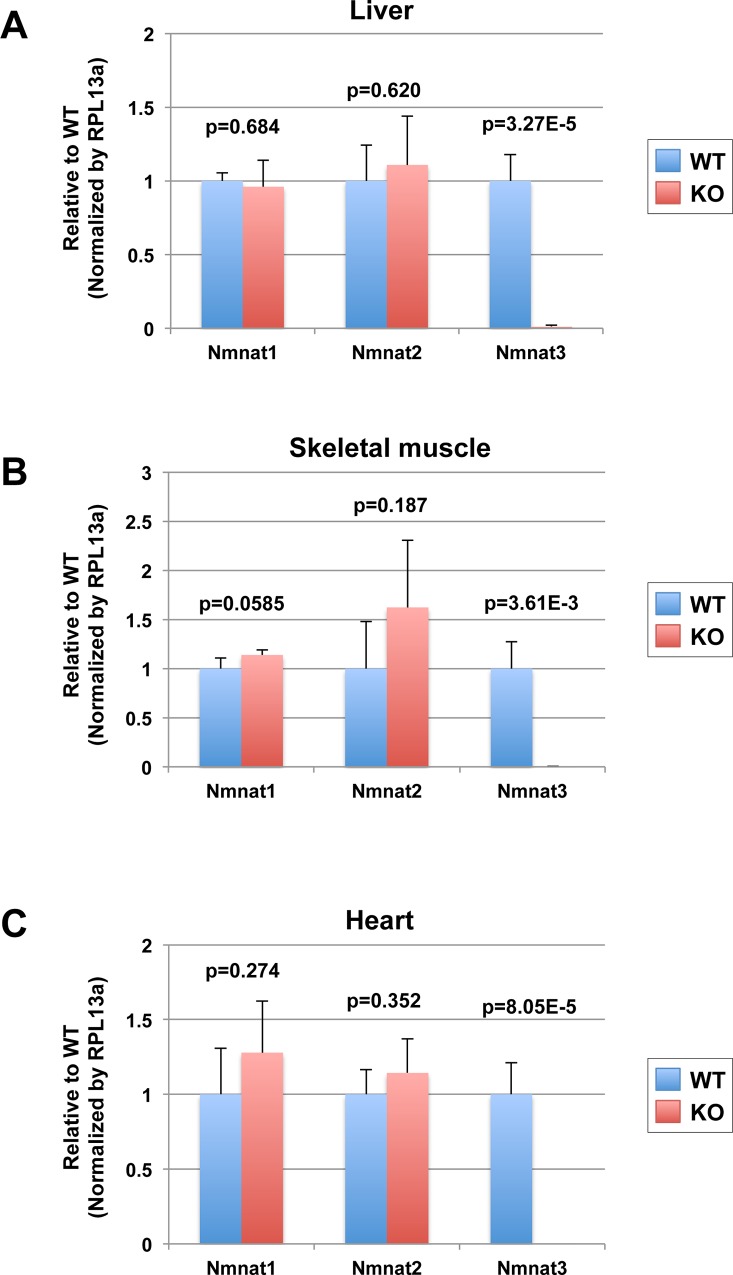
Fig 4. Nmnat1 and Nmnat2 are not up-regulated in Nmnat3 KO mice.
(A-C) Real-time quantitative PCR analysis for mRNA level of Nmnat1, Nmnat2 and Nmnat3. Total RNA was isolated from liver (A), skeletal muscle (B) and heart (C) of WT and Nmnat3 KO mice. Rpl13a gene was used as a reference gene, and data are presented as a relative value to WT for each gene (n = 4 for each group).

