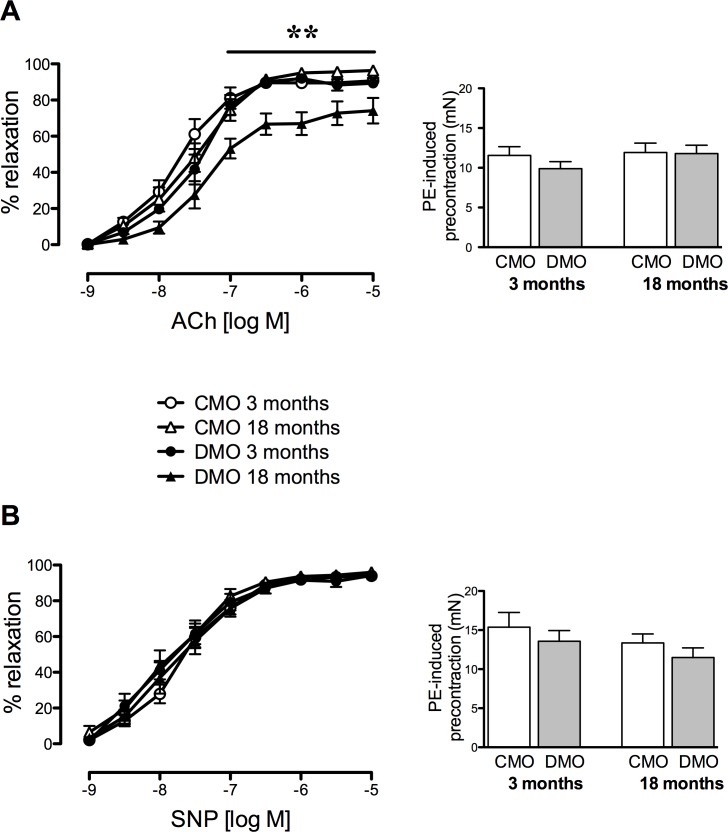
Fig 1. Vascular relaxation of mesenteric arteries in control (CMO) and diabetic (DMO) mother offspring.
Concentration-response curve to acetylcholine (ACh, A) and sodium nitroprusside (SNP, B). Bar graphs represent the level of pre-contraction induced by 10-6M phenylephrine. Values are mean ± SEM (n = 7 minimum per group). * p<0.05 and ** p<0.01 DMO vs. CMO.

