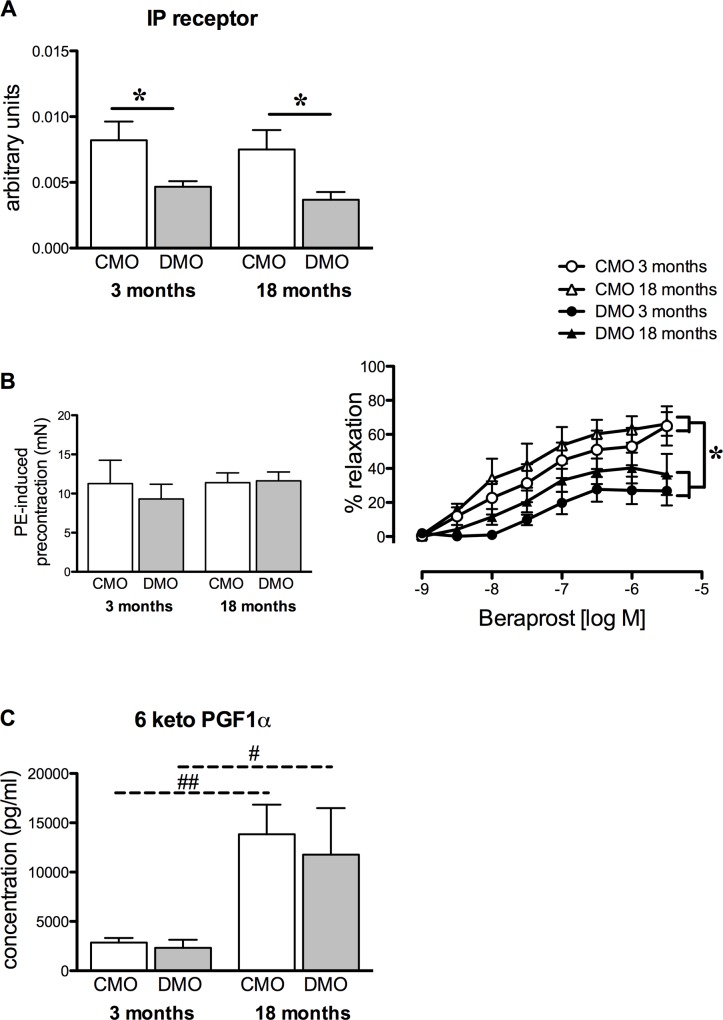
Fig 2. Prostacyclin-mediated relaxation and receptor expression level in control (CMO) and diabetic (DMO) mother offspring.
(A) Relative protein expression of the prostacyclin receptor (IP receptor) was analysed by Western-blot in mesenteric arteries of CMO (open bars, n = 5) and DMO (solid bars, n = 5); each value was normalised to β-actin protein expression. (B) Left panel represents phenylephrine (PE)-induced pre-contraction level; right panel shows concentration-relaxation response curve to beraprost of mesenteric arteries in CMO and DMO (n = 5 at 3 months and n = 7 at 18 months of age for each group). Values are mean ± SEM. (C) Measurement of serum 6-keto-PGF1-α (prostacyclin metabolite) in CMO (n = 6) and DMO (n = 6). Each bar graph represents mean ± SEM. * p<0.05 DMO vs. CMO and ## p<0.01 18 vs. 3 months-old animals.

