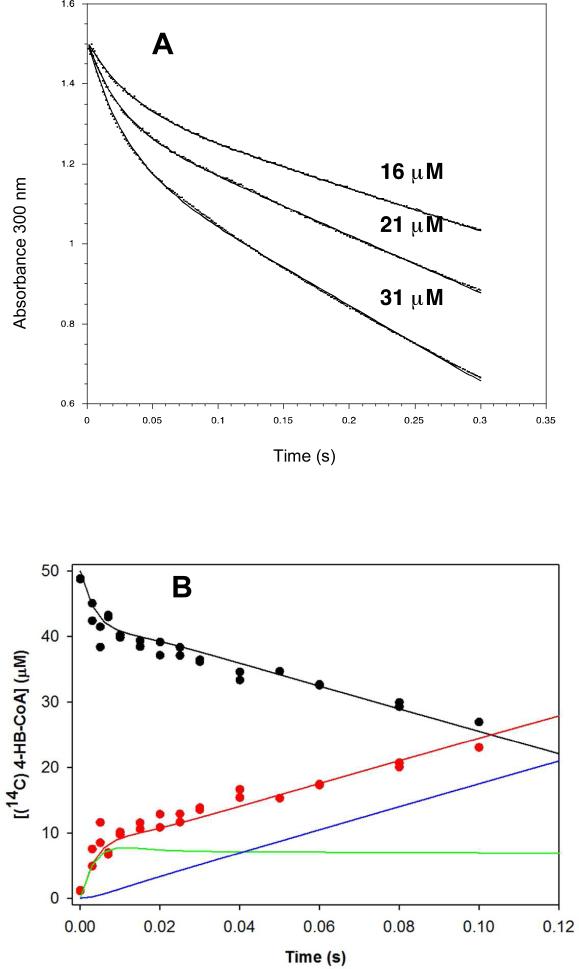
Figure 2.
(A) stopped-flow UV-vis absorbance traces of (16, 21 and 31 μM) wild-type thioesterase-catalyzed hydrolysis of (112 μM) 4-HB-CoA carried out under multiple turnover conditions and monitored at 300 nm (Δε = 11.8 mM−1 cm−1). The traces were fitted using a double exponential equation. (B) The time course for the multiple turnover reaction of 50 μM [14C]4 HB-CoA and 10 μM thioesterase monitored using rapid quench/HPLC techniques. The curves were simulated using the kinetic model shown in Scheme 2 and the microscopic rate constants k1 = 172 μM−1 s−1, k−1 = 30 s−1, k2 = 264 s−1, k−2 = 9 s−1, k3 = 25 s−1, k−3 = 0 s−1, k4 = 129 s−1 , k−4 = 5 μM−1 s−1, k5 = 368 μM−1 s−1 and k−5 = 5 μM−1 s−1. The simulated curve-coloring scheme is as follows: E-I(CoA) + E(4-HB)(CoA) + E(4-HB) + 4-HB (red); E(4-HB-CoA) + 4-HB-CoA (black); E-I(CoA) (green); E(4-HB)(CoA) + E(4-HB) + 4-HB (blue).

