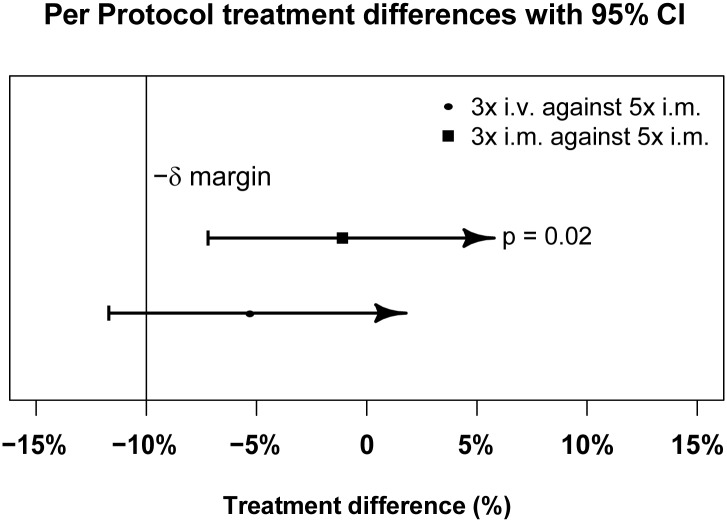
Fig 3. Per-protocol population primary endpoint analysis.
PP treatment difference in proportions of patients with ≥99% parasite reduction, with corresponding 95% confidence intervals. The vertical line indicates the non-inferiority margin (δ). The three-dose i.m. treatment group is non-inferior to the five-dose i.m. treatment group (p = 0.02), whereas the three-dose i.v. group is not non-inferior (p = 0.24). Note that the p-value is calculated using Fisher’s exact test for one-sided equivalence under the assumption that both regimens are equally efficacious.

