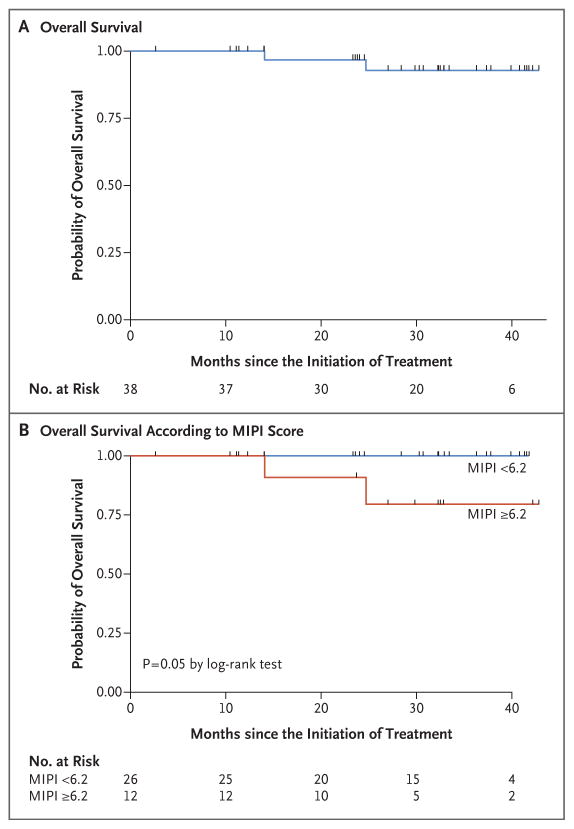
Figure 2. Overall Survival.
Panel A shows the probability of overall survival among all 38 patients. Panel B shows the probability of overall survival according to the baseline MIPI score — lower than 6.2 (indicating low-risk or intermediate-risk disease) versus 6.2 or higher (indicating high-risk disease).

