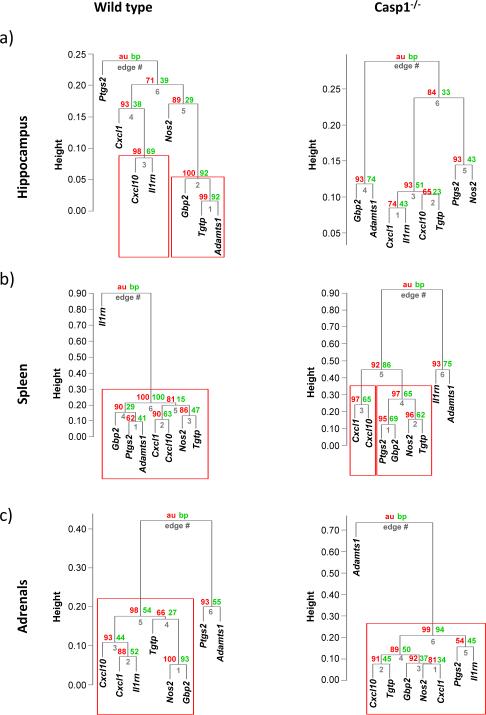
Figure 2.
Hierarchical cluster analysis of gene expression levels with AU- and BP-based P-values (in red and green, respectively). The vertical distance between the gene expression levels indicate how dissimilar they are. Results for (a) hippocampus, (b) spleen and (c) adrenal tissues are presented. The genes shown inside the red boxes clustered together according to an approximately unbiased (AU) probability set at ≥95% level, after bootstrap re-sampling.

