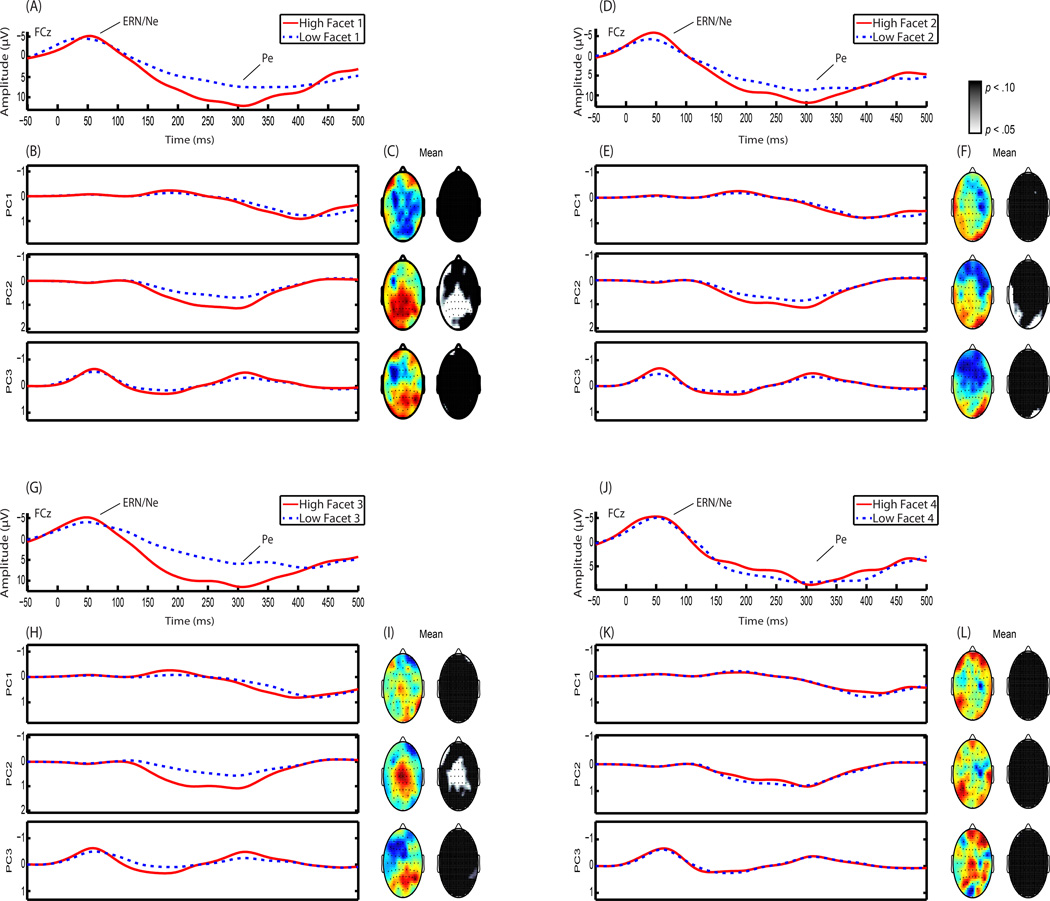
Figure 3.
Response-locked event-related potential (ERP) and Principal Component Analysis (PCA) plotted at FCz with Psychopathy Checklist-Revised (PCL-R) Facet scores: (A) Average waveforms by upper (solid red line; n = 34) and lower (dashed blue line; n = 33) PCL-R Facet 1 quartiles are plotted. (B) Principal components are plotted for upper and lower quartiles of PCL-R Facet 1 scores. (C) Topographical difference (color) and correlation (black & white) maps are plotted for each principal component highlighting individuals which high PCL-R Facet 1 scores have increased Pe amplitude. (D) Average waveforms by upper (solid red line; n = 28) and lower (dashed blue line; n = 24) PCL-R Facet 2 quartiles are plotted. (E) Principal components are plotted for upper and lower quartiles of PCL-R Facet 2 scores. (F) Topographical difference (color) and correlation (black & white) maps are plotted for each principal component highlighting minimal relationship between ERN/Ne and Pe with PCL-R Facet 2 scores. (G) Average waveforms by upper (solid red line; n = 31) and lower (dashed blue line; n = 24) PCL-R Facet 3 quartiles are plotted. (H) Principal components are plotted for upper and lower quartiles of PCL-R Facet 3 scores. (I) Topographical difference (color) and correlation (black & white) maps are plotted for each principal component highlighting individuals which high PCL-R Facet 3 scores have increased Pe amplitude. (J) Average waveforms by upper (solid red line; n = 24) and lower (dashed blue line; n = 28) PCL-R Facet 4 quartiles are plotted. (K) Principal components are plotted for upper and lower quartiles of PCL-R Facet 4 scores. (L) Topographical difference (color) and correlation (black & white) maps are plotted for each principal component highlighting no relationship between ERN/Ne and Pe with PCL-R Facet 4 scores.

