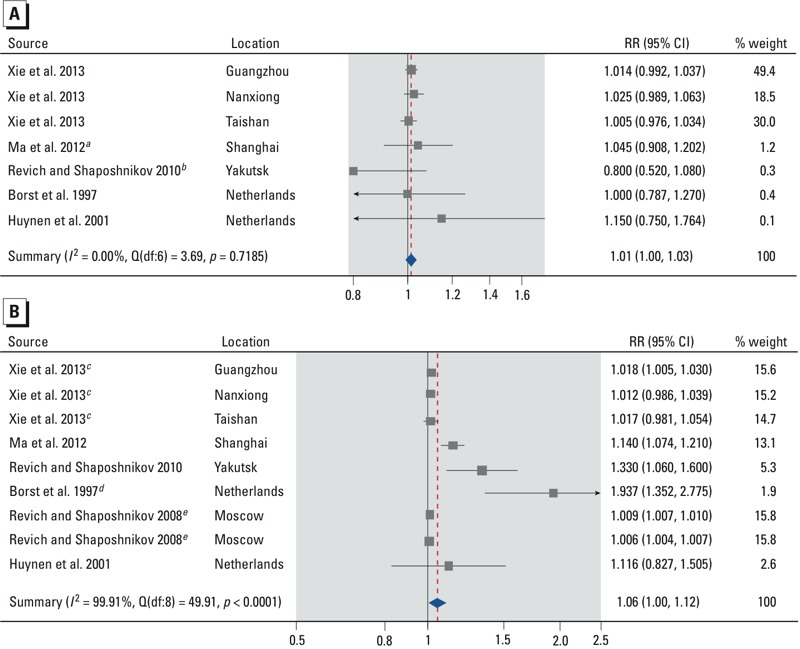
Figure 4.

Forest plots showing the association between cold spells and mortality from all non-accidental causes by age: 0–64 years (A) and ≥ 65 years (B). Effect estimates are displayed on a logarithmic scale. The three independent effect estimates for Xie et al. (2013) represent cold spells in 3 different cities. The two independent effect estimates for Revich and Shaposhnikov (2008) represent 2 different cold spells. Additional details about the study-specific effect estimates are provided in the Supplemental Material, “Part 1” and Tables S6–S7. Abbreviations: df, degrees of freedom; I2, total heterogeneity / total variability; Q, Q-statistic; RR, mortality rate ratio. aThe effect estimate was calculated using the effect estimates for non-accidental mortality in the age strata 0–4, 5–44, and 45–64 years in the two-stage meta-analysis. bThe effect estimate is for the age stratum 30–64 years. cThe city-specific effect estimates were calculated using the city-specific effect estimates for nonaccidental mortality in the age strata 65–74 and ≥ 75 years in the two-stage meta-analysis. dThe effect estimate was calculated using the effect estimates for mortality from all causes in the age strata 65–74, 75–84, 85–94, and > 95 years in the two-stage meta-analysis. eThe cold spell-specific effect estimates are for the age stratum ≥ 75 years.
