
Figure 1.
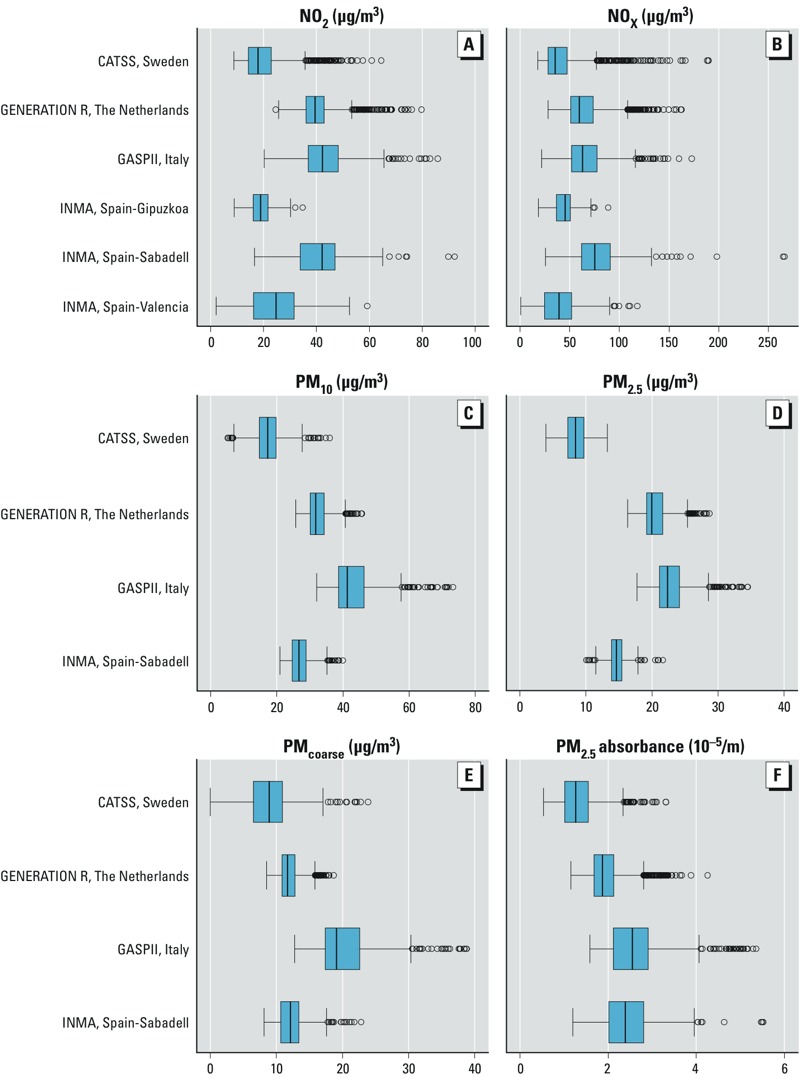
Distribution of air pollutant levels during pregnancy: (A) NO2; (B) NOx; (C) PM10; (D) PM2.5; (E) PMcoarse; (F) PM2.5 absorbance. Air pollution levels were temporally adjusted to the exact pregnancy period. Boxes extend from the 25th to the 75th percentile, vertical bars represent the median, whiskers extend 1.5 times the length of the interquartile range above and below the 75th and 25th percentiles, respectively, and outliers are represented as points. PM10, PM2.5, PMcoarse, and PM2.5absorbance were not available in the Spanish cohorts of Gipuzkoa and Valencia.