
Figure 2.
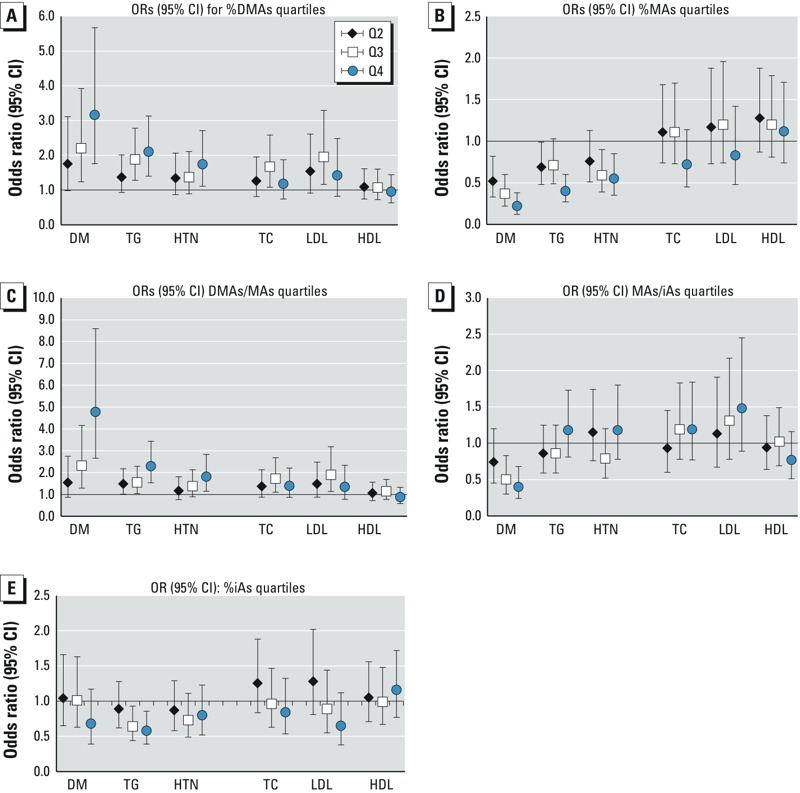
Associations between urinary As metabolism indicators and cardiometabolic risk. Odds ratios (95% CIs) for elevated cardiometabolic risk associated with increasing quartiles of urinary iAs metabolism indicators from multinomial or logistic models adjusted for total speciated urinary arsenic, as well as age, sex, education, ethnicity, weight status, waist circumference, smoking status, alcohol consumption, recent seafood intake, and water source (well, treatment plant, or other). n = 1,090 Adults. Cardiometabolic markers: DM, diabetes mellitus; HDL, high-density lipoprotein cholesterol; HTN, hypertension; LDL, low-density lipoprotein cholesterol; TC, total cholesterol; TG, triglycerides. Urinary As indicators: DMAs, dimethylarsenic; iAs, inorganic As; MAs, methylarsenic. Cardiometabolic outcomes defined as follows: DM, fasting plasma glucose ≥ 126 mg/dL, 2-hr plasma glucose ≥ 200 mg/dL, or self-reported diabetes diagnosis or medication use; elevated TC ≥ 200 mg/dL; elevated TG ≥ 200 mg/dL; elevated LDL ≥ 130 mg/dL; low HDL = < 40 mg/dL; hypertension SBP > 140 mmHg, DBP > 90 mmHg or anti-hypertensive medication use. Quartile markers (1st = referent): 2nd, black diamond; 3rd, white square; 4th, blue circle. Quartile cutoffs for urinary As metabolism indicators defined as follows: (A) %DMAs = < 70.65, 70.65 to < 76.78, 76.78 to < 81.52, ≥ 81.52; (B) %MAs = < 10.90, 10.90 to < 14.0, 14.0 to < 17.66, ≥ 17.66; (C) DMAs/MAs = < 4.05, 4.05 to < 5.47, 5.49 to < 7.38, ≥ 7.38; (D) MAs/iAs = < 1.185, 1.185 to < 1.576, 1.576 to < 2.11, ≥ 2.11; (E) %iAs = < 6.389, 6.389 to < 8.873, 8.873 to < 12.270, ≥ 12.270.