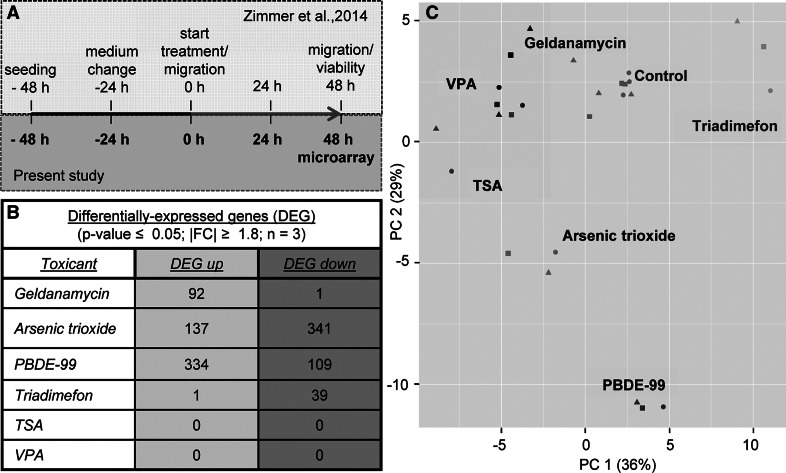
Fig. 1.
Experimental design and transcriptome data structure of test battery hits. a Sampling for microarray analysis was performed in neural crest cells after 48-h exposure (red arrow) to non-cytotoxic and migration-inhibiting concentrations of six test battery hits (geldanamycin, arsenic trioxide, PBDE-99, triadimefon, TSA and VPA), as identified by the method and the data published in Zimmer et al. (2014). b The differentially expressed genes (DEG) were identified for each condition: the number of up- (DEG up) and downregulated genes (DEG down) are shown in the table (details can be found in the supplementary material; p values were FDR-corrected). c Principal component analysis (PCA) was performed, based on the 100 transcripts with highest variance, and a 2D plot was generated to display the transcriptome data structure across compounds and experimental replicates. Each point represents one experiment (= data from one microarray), where the chemical label supported by the colour coding indicates the compound and the form of the data points indicates the replicate. The percentages of the variances covered are indicated on the axes (colour figure online)

