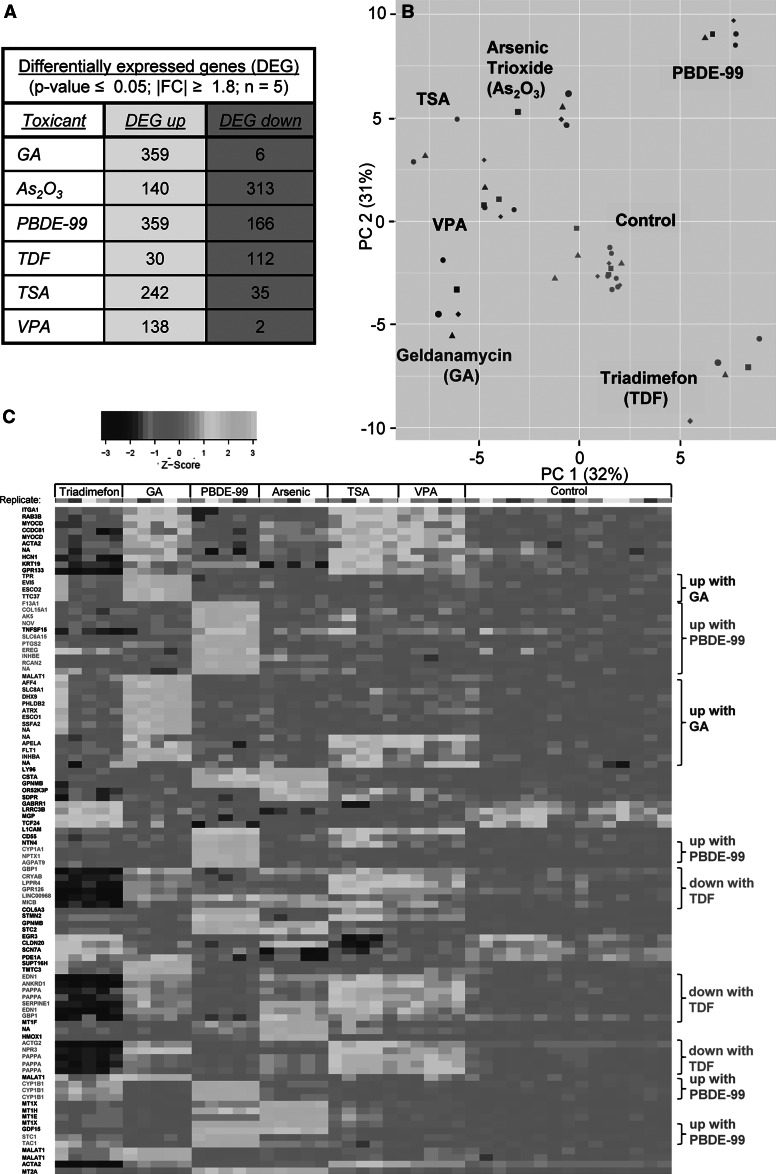
Fig. 3.
Overall transcriptome changes based on pooled data sets. a Training and testing expression data sets were analysed together to identify overall transcriptome changes. The number of differentially expressed genes significantly up- or downregulated is listed in the table for each condition (detailed data are shown in supplemental material). b The transcriptome data structure was displayed as principal component analysis (PCA) 2D plot showing the first two principal components. Percentages of covered variances are indicated on the axes. c The transcriptome data were represented as heatmap indicating the gene expression values of the top 100 probe sets with the highest variability amongst the compounds. Expression values of the individual genes were transformed to z scores (along rows). On the right some exemplary gene groups are indicated for guidance (e.g. genes upregulated specifically by geldanamycin)

