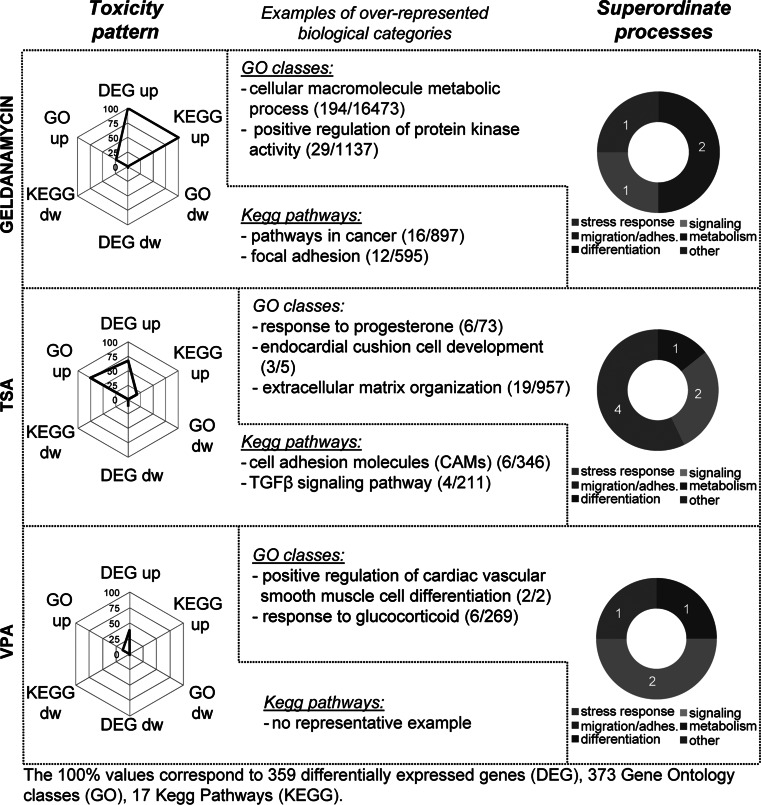
Fig. 6.
Alteration of superordinate biological processes by drugs. Toxicity patterns triggered by the compounds belonging to the class of ‘drugs’ (geldanamycin, TSA, VPA) are presented as in Fig. 5. The spider diagrams indicate normalized numbers of differentially expressed genes (DEG), GO terms overrepresented amongst DEG (GO) and overrepresented KEGG pathways (KEGG). The absolute values used for normalization of each axis are indicated at the bottom of the figure. They correspond to the respective highest value for all 6 compounds. The ring diagrams show the relative distribution of 6 superordinate biological processes (stress response, migration/adhesion, metabolism, differentiation, signalling and other) amongst the DEG. In the middle, examples of overrepresented biological categories (KEGG, GO) are shown (with numbers of regulated and total genes belonging to the specific group)

