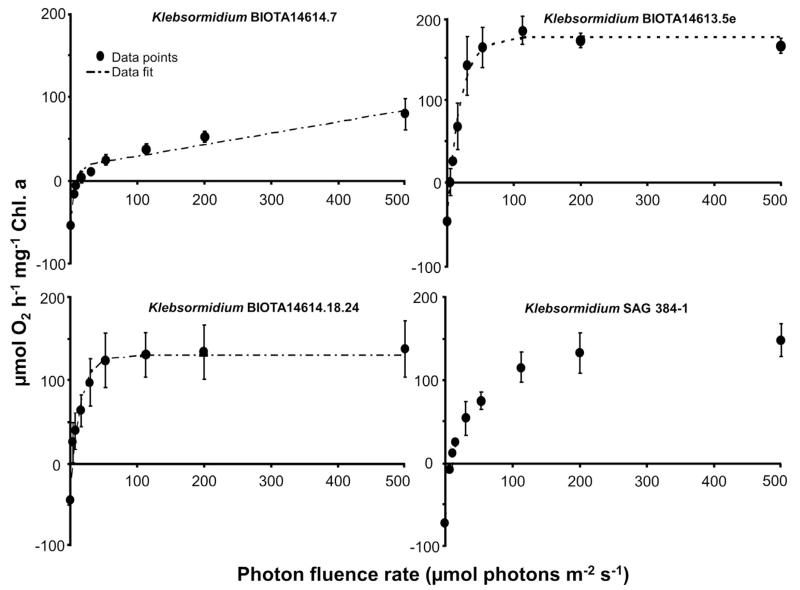
Fig. 2.
Dark respiration and photosynthetic oxygen evolution as function of increasing photon fluence densities up to 500 μmol photons m−2 s−1 in the four Klebsormidium isolates BIOTA 14614.7 (African Strain A), BIOTA 14613.5e (African Strain B), BIOTA 14614.18.24 (African Strain C) and SAG 384-1 (Arctic Strain) (n = 3, mean value ± SD). The dotted line represents in the 3 African Strains a fitted curve of the data measured according the photosynthesis model of Webb et al. (1974).

