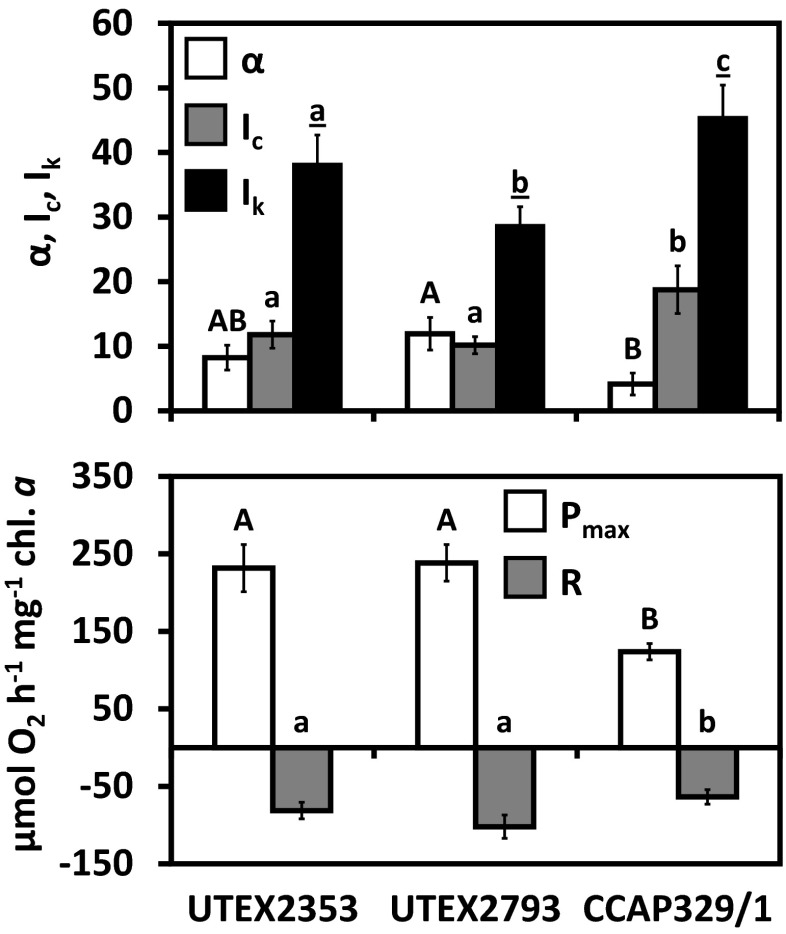
Fig. 5.
Comparison of five photosynthetic parameters derived from oxygen light curves (Webb et al. 1974) (n = 3 ± SD). UTEX2353: Entransia fimbriata; UTEX2793: E. fimbriata; CCAP329/1: Hormidiella attenuata. Significantly different means between the algal strains are indicated by capital letters [α; μmol O2 h−1 mg−1 chl. a (μmol photons−1 m−2 s–1)–1; P max: μmol O2 h−1 mg−1 chl. a], small letters (I c: μmol photons m−2 s−1; R: μmol O2 h−1 mg−1 chl. a), and underlined small letters (I k: μmol photons m−2 s−1). Comparison was performed by one-way ANOVA followed by Tukey’s post hoc test (P < 0.05)

