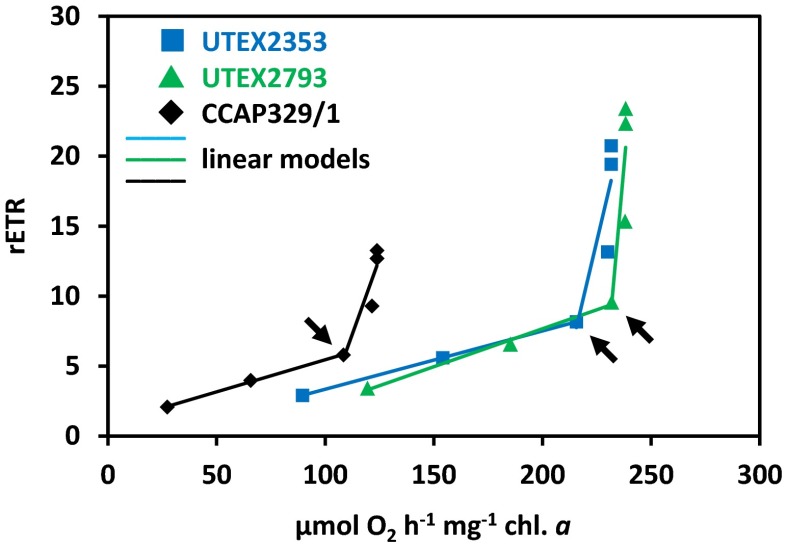
Fig. 8.
Correlation of the oxygen production and relative electron transport rate (rETR) of UTEX2353 (Entransia fimbriata), UTEX2793 (E. fimbriata), and CCAP329/1 (Hormidiella attenuata) in response to increasing photon fluence rates (30, 55, 105, 200, 490, and 1000 μmol photons m−2 s−1). Linear regression models were used to describe the correlation from 30 to 105 and from 105 to 1000 μmol photons m−2 s−1. The oxygen production versus rETR at 105 μmol photons m−2 s−1 is marked with arrows

