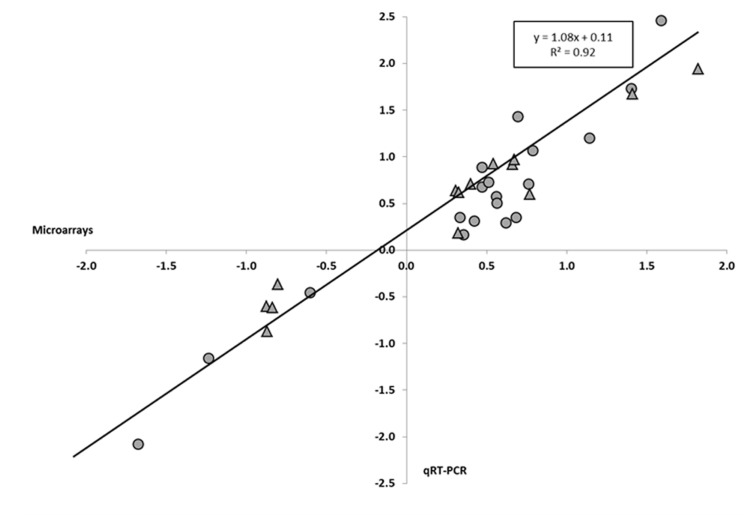
FIGURE 1.
Pearson’s correlation between gene expression levels determined by quantitative reverse transcriptase PCR (qRT-PCR) and microarrays for Hirschfeldia incana. The diagram represents the correlation between gene expression obtained with the microarray and qRT-PCR for H. incana plantlets treated with 100 μM Pb(NO3)2 for 3 days. Values are Log10 of the fold change (FC) obtained for the same genes with the microarray (x axis) and qRT-PCR (y axis). FC values for roots (circles) and shoots (triangles) are reported in Additional File 6 in Supplementary Material.

