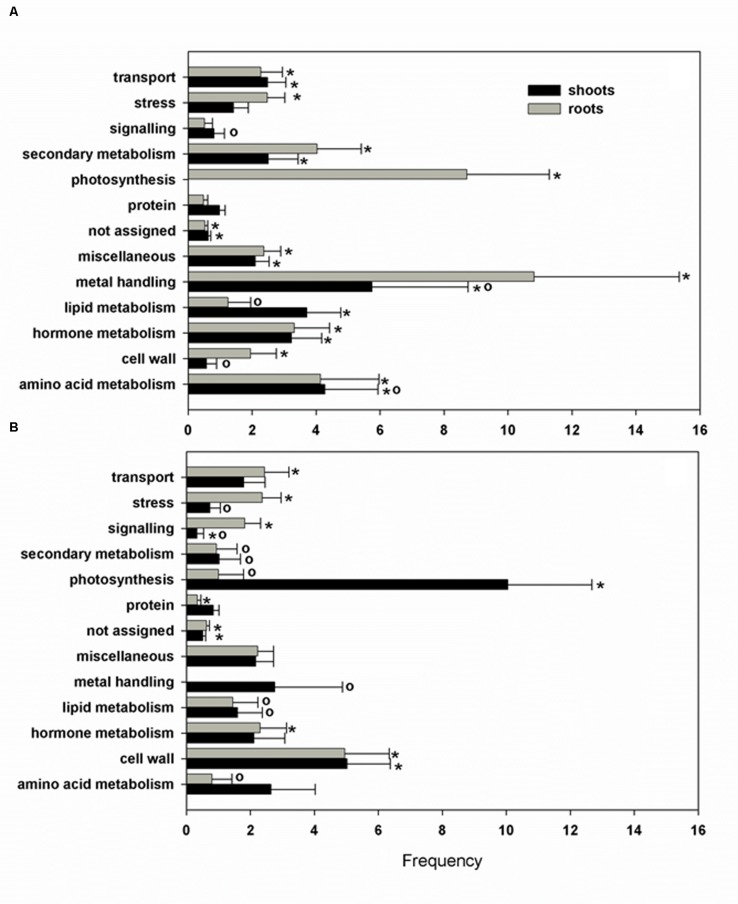
FIGURE 3.
Biological process classification of Pb responsive selected transcripts. The gene ontology was obtained using the Classification SuperViewer software with MapMan classification source for selected up- (A) and down-regulated (B) genes. Normed frequency was calculated as follows: (Number in class input set/Number in classified input set)/(Number in class reference set/Number in classified reference set). ∗Significant class (p > 0.05), o, size less than 5 genes.

