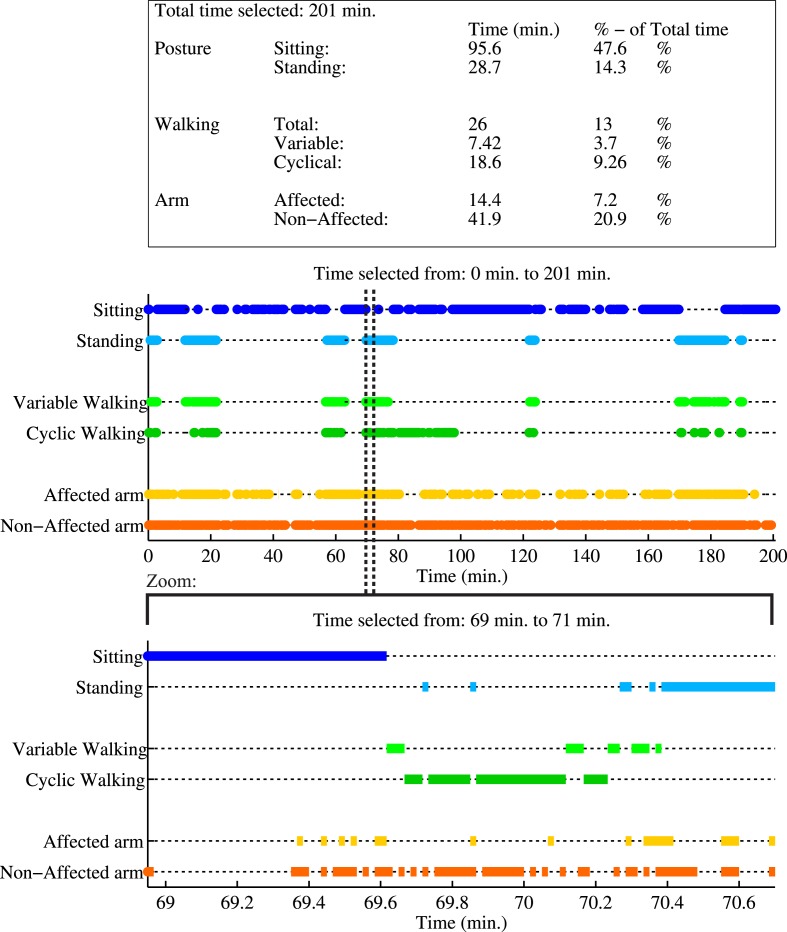
Figure 5.
Example report of the activity monitor of a measurement session of P2, performing activities of daily living. First a summary report of all activities during the whole measurement is shown in the table, where the activity times are mentioned in minutes and as percentage of the total duration of the measurement session. The first graph shows the activity classification as a function of time for the whole measurement. A zoom of a selected time period is given in the lower graph. In this selection, the patient is first seated, next raises up from a chair, walks in a cyclical pattern (at least three consecutive alternating steps of both feet), and finally stands still. During this period, the non-affected arm is used more frequently than the affected arm.

