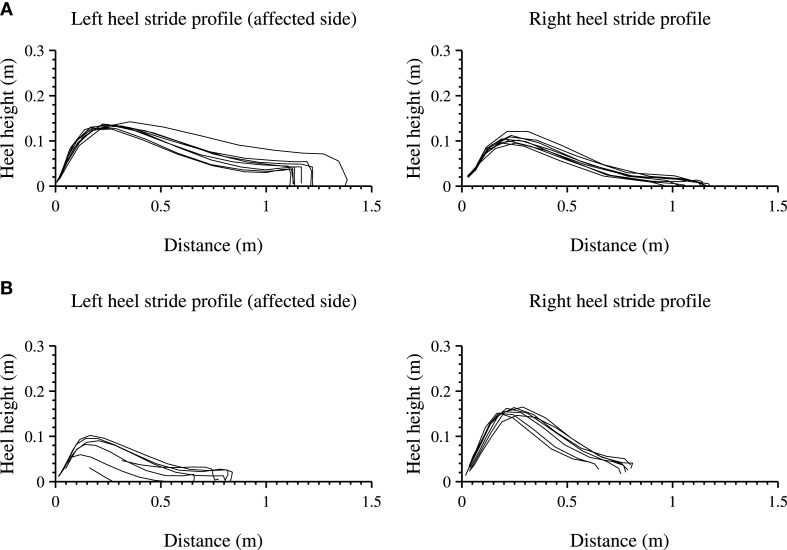
Figure 6.
Heel stride profiles during a structured and unstructured measurements of the left (affected side) and right foot. Each line indicates a three-dimensional stride profile, rotated and projected onto a two-dimensional plane, starting at the origin of the graph. (A) shows a 10-m walk test, a structured in-clinic measurement. (B) shows an unstructured in-home measurement, where the patient walked in a straight line.

